DataGraph
-
Getting Started
-
User Interface
-
Data
-
Columns
-
Variables
-
Commands
-
Layout settings
-
Customize
-
Functions
-
Exporting
-
Scripting
-
Beta
-
Versions
-
Join the Community
Print
Two Sample t-Test
Updated
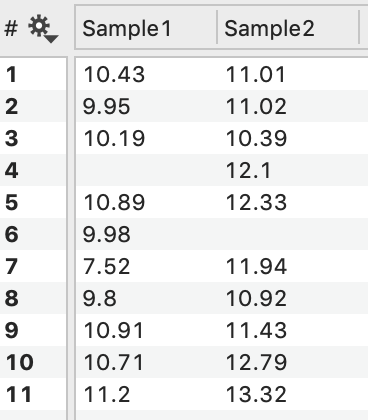
Sample 1: 10.43, 9.95, 10.19, 10.89, 9.98, 7.52, 9.8, 10.91, 10.71, 11.2
Sample2: 11.01, 11.02, 10.39, 12.1, 12.33, 11.94, 10.92, 11.43, 12.79, 13.32
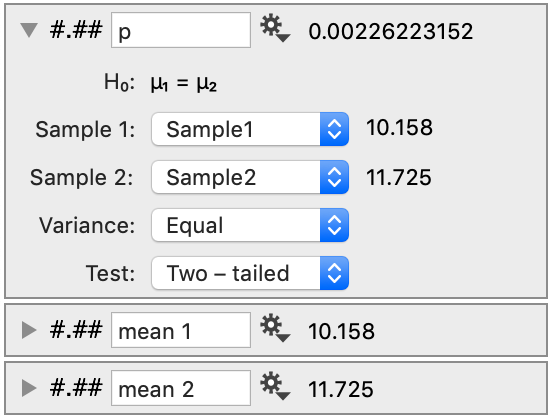
Input
Samples
Select a column of data for Sample 1 and Sample 2.
Once selected, the mean is calculated and shown the right of the menu.
They do not need to be equal in length.
Variance
Choose whether your samples have equal variance or unequal variance.
Test
Choose between a two-tailed test and a one-tailed (one-sided) test.
Output
The output is the p-value.
On This Page