Map column
The Map column allows you to map a column to a text or numerical value. Choose between mapping methods for either an exact match or a match using an interval. Connect data sets using a key-value pair.
Create a map column
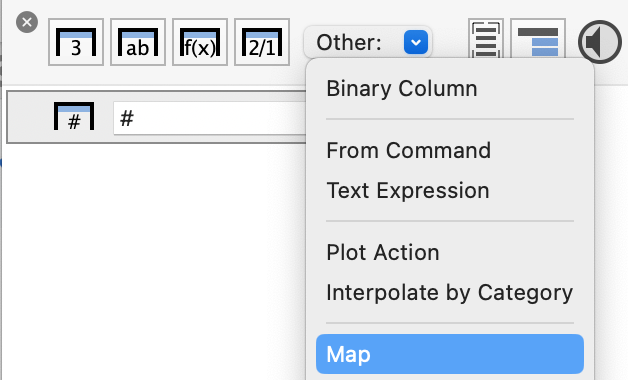
There are two ways to create this column type. The first is to use the Other drop-down menu and select Map.
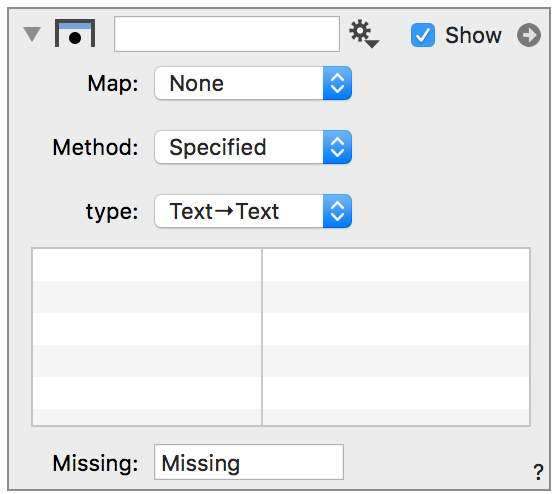
This will create the following entry in the column list. The Method is set to ‘Specified’ by default, which allows you to enter the exact text to map.
The second method is to use a gear menu shortcut to automatically create a Map column when you are connecting two sets of data. That method is described in the From column section.
Exact Match
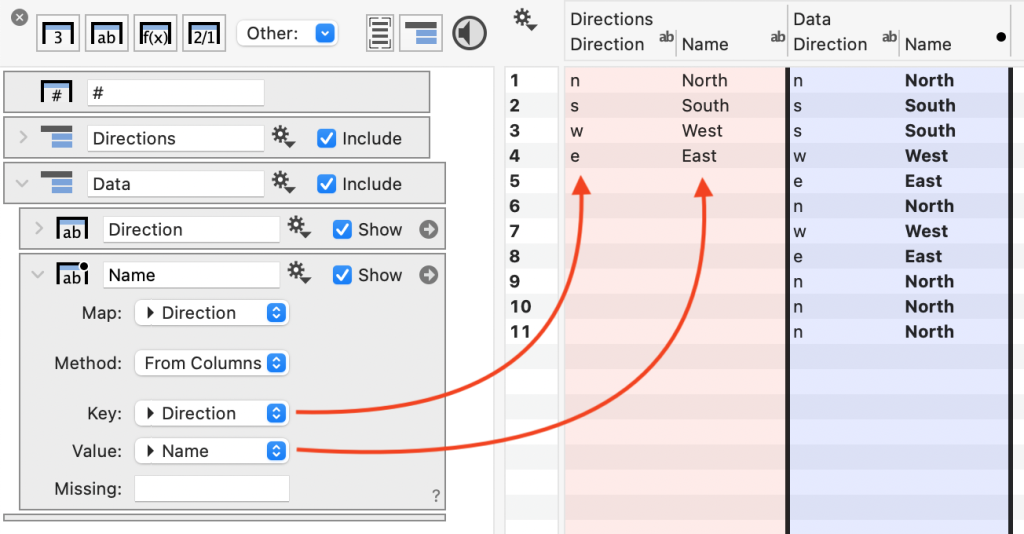
Use the Map dropdown menu to select the column in the data table you want to use as a basis for the map column.
In the example below, the column called ‘Direction’ has a single letter to indicate north, south, west, or east. The table in the map column object is used to set up the key-value pairs that map the single letter to the full name.
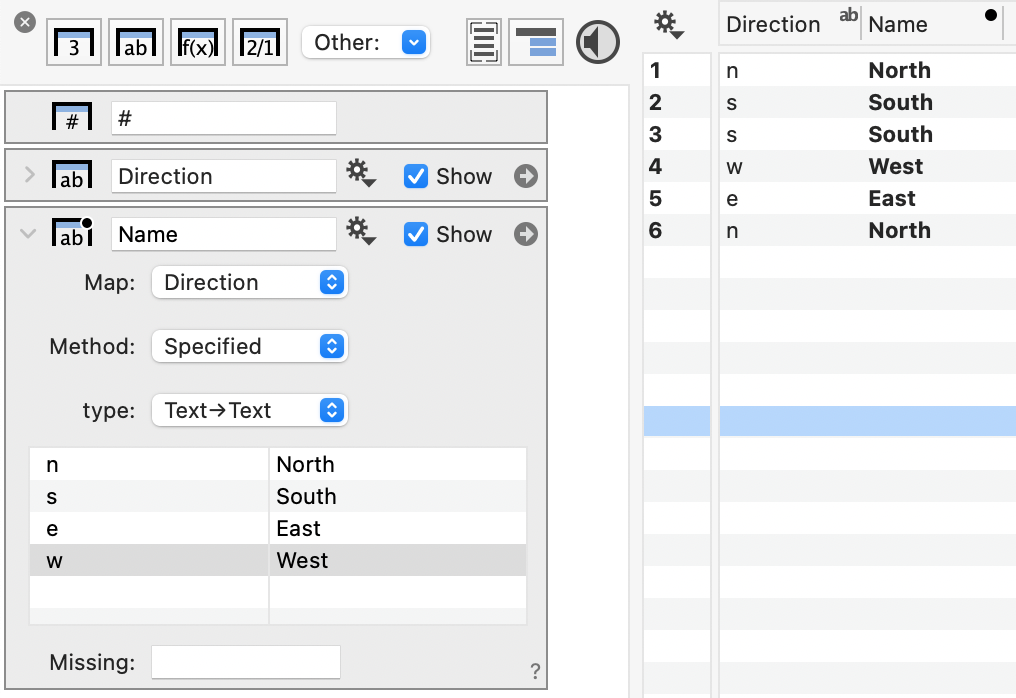
Note that you have to select the column type coming in and out of the map column. In this example, both are text columns, but you can map text to numbers, numbers to numbers, or numbers to text.
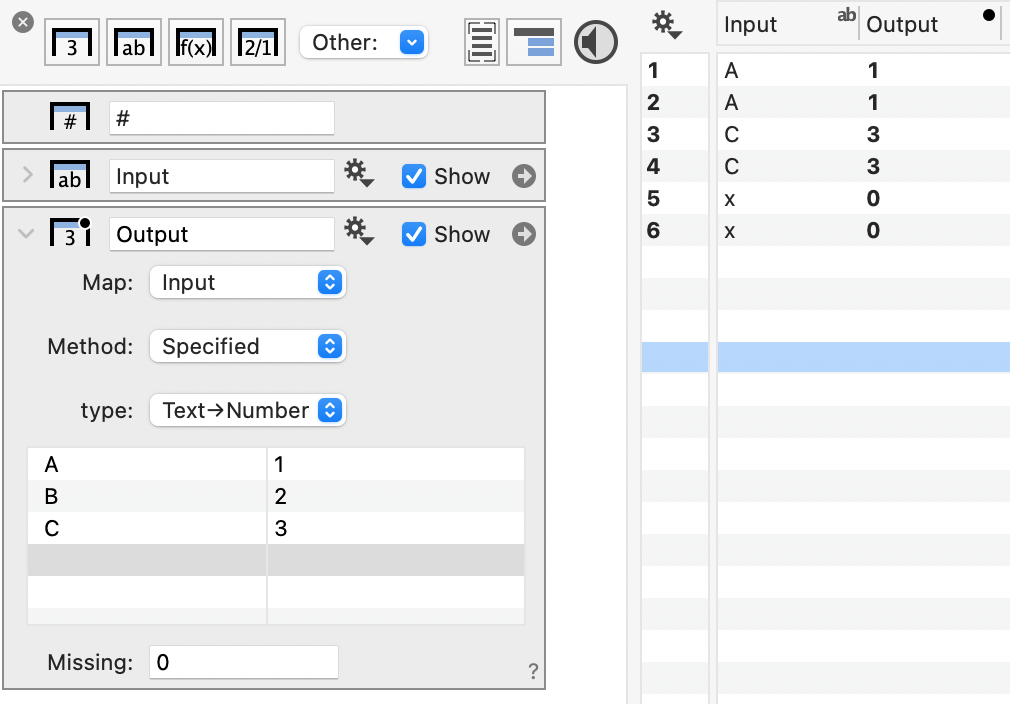
At the bottom of the Map column, you can specify what to output for a missing value. In the above example, a ‘0’ is output for row entries that do. not have a match.
From Columns
The key value pairs can come from columns. To use this approach, change the Method to ‘From columns’. This changes the options that follow to show menu selectors for the key-value pairs.
Manual Entry
The key-value pairs don’t have to come from a different column group, but this approach can be helpful to keep your data separate, as shown in the following example.
Autogenerate
The gear menu contains a shortcut that makes it easy to connect two groups of data, where you have a key value, with the same name, in both groups.
This will automatically create the Map column and populate the menu selectors in one action.
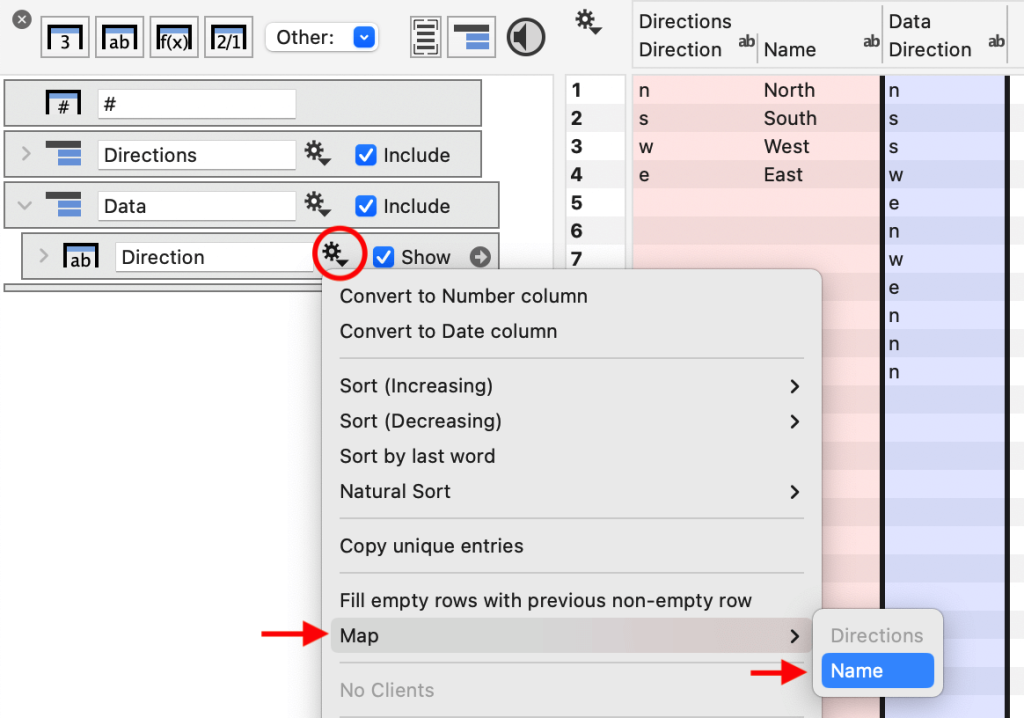
So although you don’t have to use the same names for the column you are mapping and in the key-value pair, doing so makes it possible for the above shortcut to work.
When using the gear menu shortcut, the program will show every group where you have a matching column name along with a list of every column you can map to.
Example
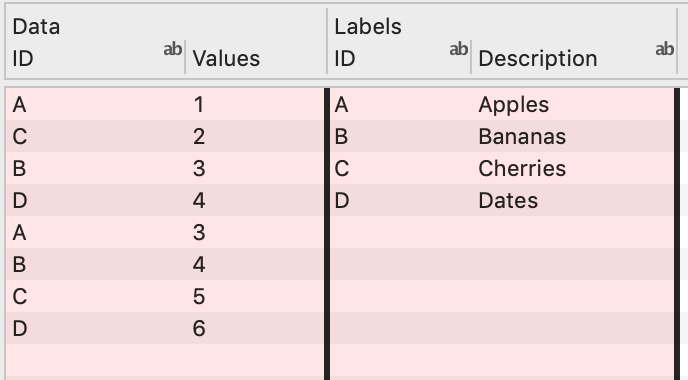
For example, here we have two groups of data:
- Data: contains ID and Value
- Labels: contains ID and Description
The key-value pair is the ‘ID’ and ‘Description’ columns from the group Labels.
To connect the groups:
- Click the gear menu on the ‘ID’ column in Data
- Select Map
- Chose from the list of options (Here ‘Description’)
The options shown in the Map menu are automatically populated, by all groups with a column having the same key value.
Intervals
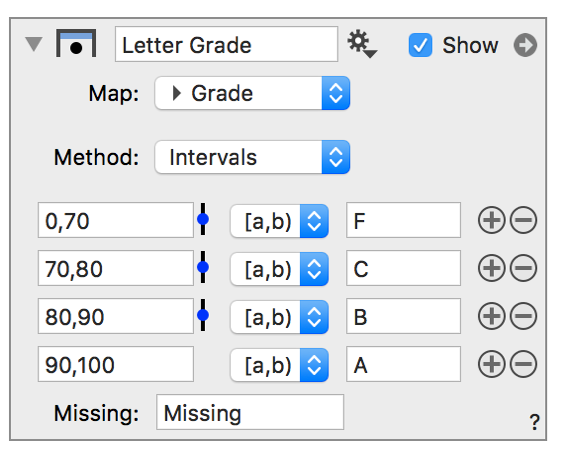
You can also define intervals. For example, you could use this option to map a numerical value to a letter grade.
When you first change the Method to Intervals, the column change to give you a way to build a table of intervals. Initially, you see just one interval set up from (0,1) which is mapped to the text ‘Label’.
To add more intervals click the plus symbol.
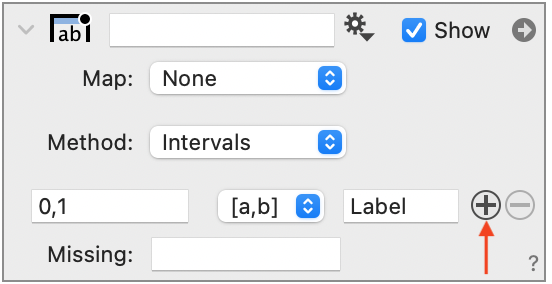
There is also a drop-down menu where you can choose the logic for the mapping, By default, the logic is set to [a,b], meaning the interval is defined as ‘a≤value≤b’. You have four options. For example, [a,b) means ‘a≤value<b’.