-
Getting Started
-
User Interface
-
Data
-
Columns
-
Variables
-
Commands
-
Layout settings
-
Customize
-
Functions
-
Exporting
-
Scripting
-
Beta
-
Versions
-
Join the Community
Slider
The Slider is a numeric variable that you can vary quickly, using a slider.
Key Features:
- Use to mask data in graphs.
- Use to vary inputs to a function.
- Use for both numbers and dates.
- Set the range directly or using other variables.
Create
Create by clicking the Slider variable button in the data side panel.

Assign a name to the variable. In the example below, we have named the Slider variable ‘A’.

The Slider has a default value of zero. As you move the slider bar back and forth, the value of ‘A’ will vary from 0 to 1.
Range
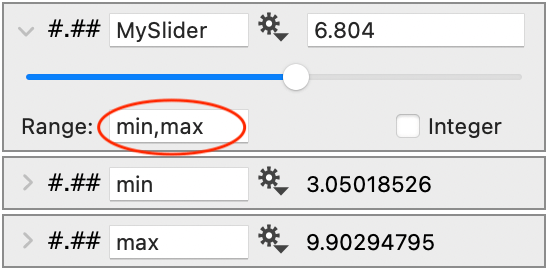
Note that the value of the slider is limited to the specified range, but you can modify the range to any values you choose (begin, end).
The range can be set by entering numeric values or using variables. For example, a Number from column variable can be used to pull the min and max from a data column. Then those variables are used to set the range for the slider. Thus, when the data changes the min, max, and slider range will all stay up to date.

Integer
You can also select the Integer check box on the bottom right to limit the numbers that the slider moves between integers only.

Dates
Sliders can also be used to cycle through dates. In the range, enter the beginning and ending dates as YYYY:MM:DD.
For example, to cycle through every day in the year 2000 enter the range as (2000:01:01, 2000:12:31).
