-
Getting Started
-
User Interface
-
Data
-
Columns
-
Variables
-
Commands
-
Layout settings
-
Customize
-
Functions
-
Exporting
-
Scripting
-
Beta
-
Versions
-
Join the Community
Freehand command
This command is in the Beta version of DataGraph. Feedback on this command is appreciated!
The Freehand command allows you to interactively draw lines that overlay on the drawing canvas for a graph.
These lines are formed using Bézier curves.
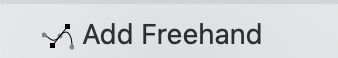
To add this command, select Add Freehand from the command menu.
Set the Background so that the commands on the graphical be seen.
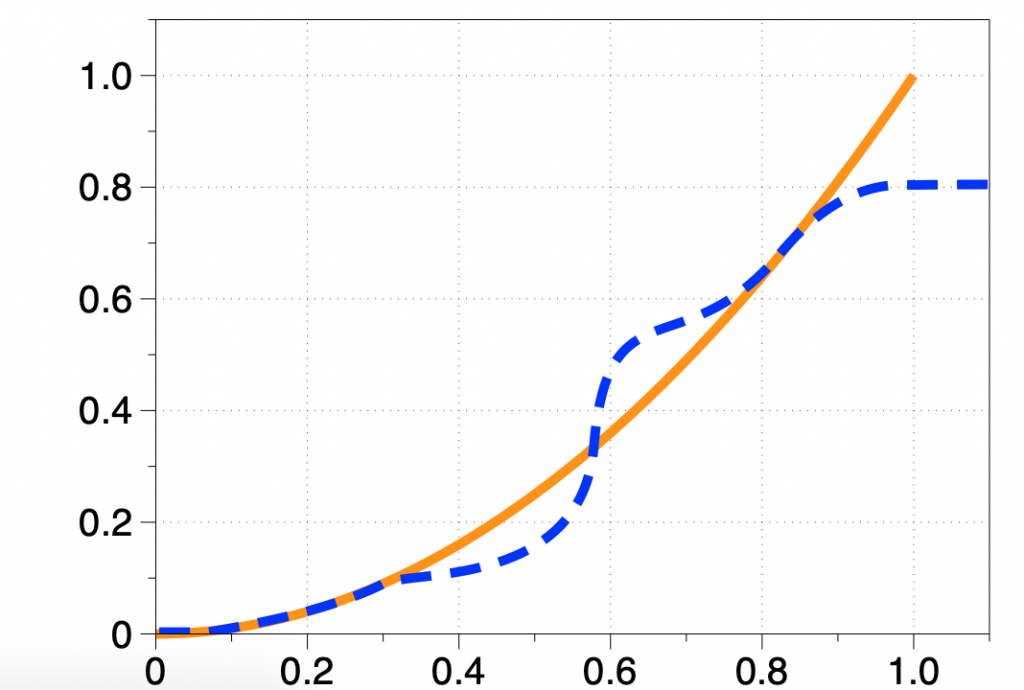
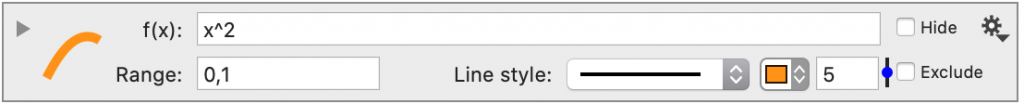
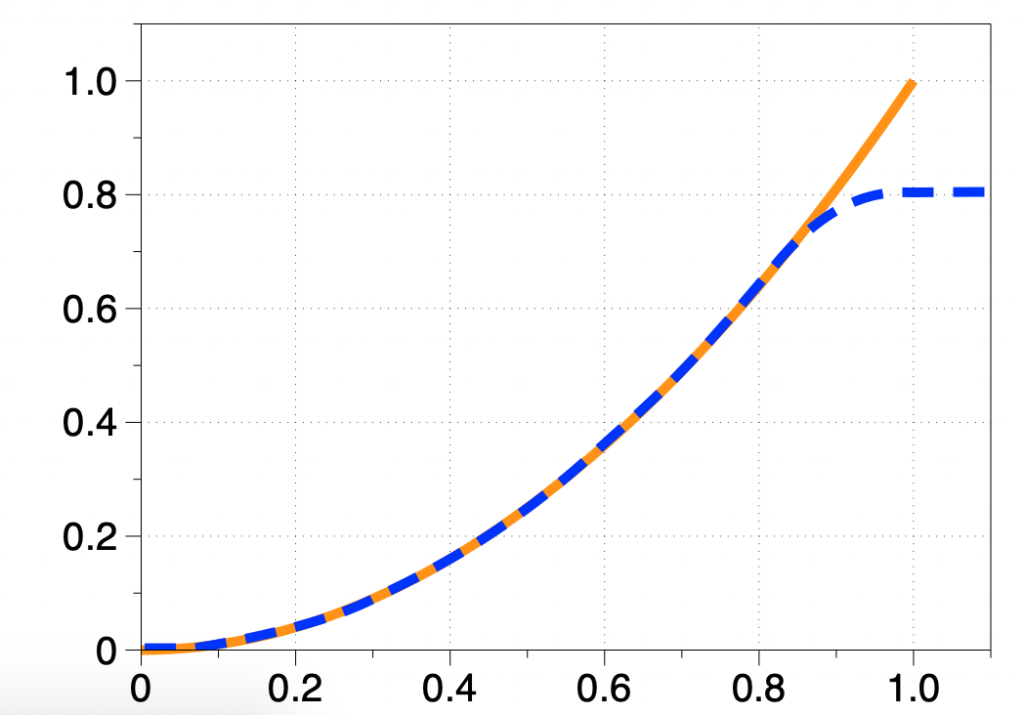
For example, here is a Function command drawing x^2.
With the Background set to 50% you can trace the function and then show a deviation.
Here is what is drawn on the canvas.
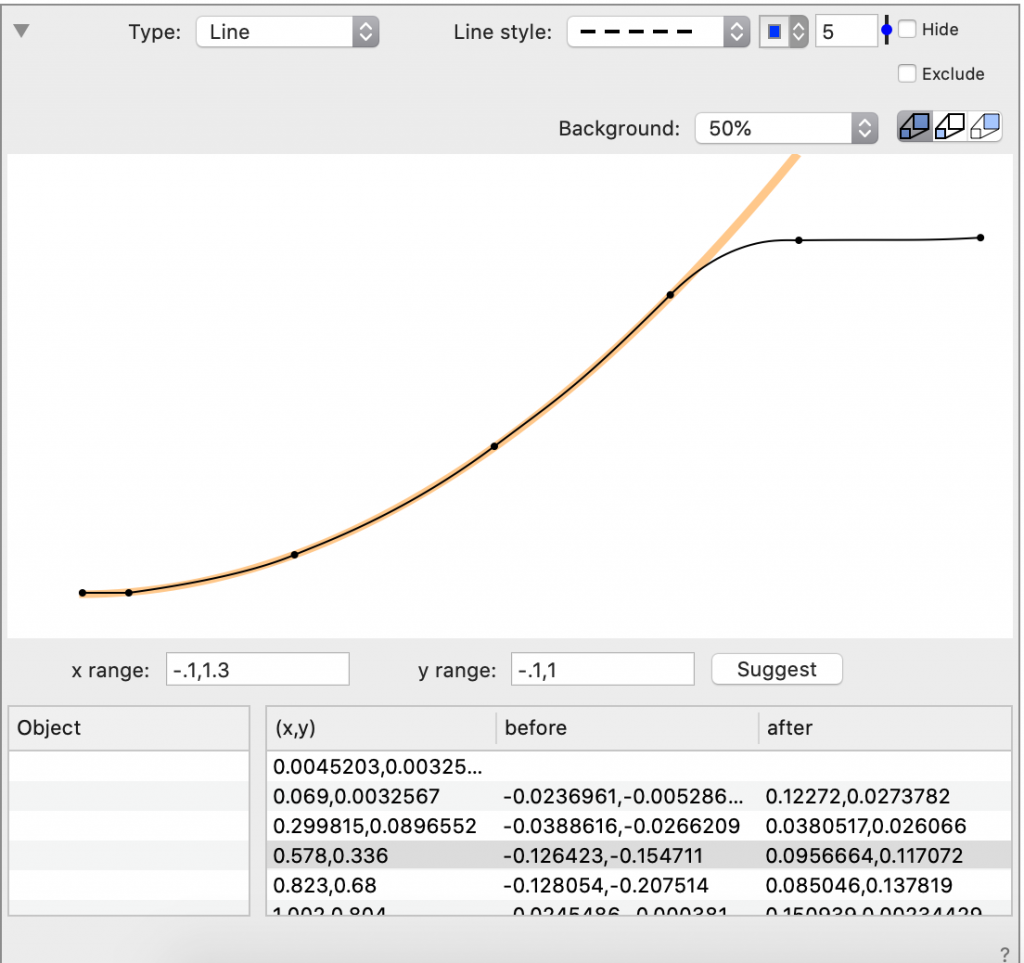
Click on any point to see the location of the curves control points. You can click and drag these interactively to set the slope of the curve at a particular location.
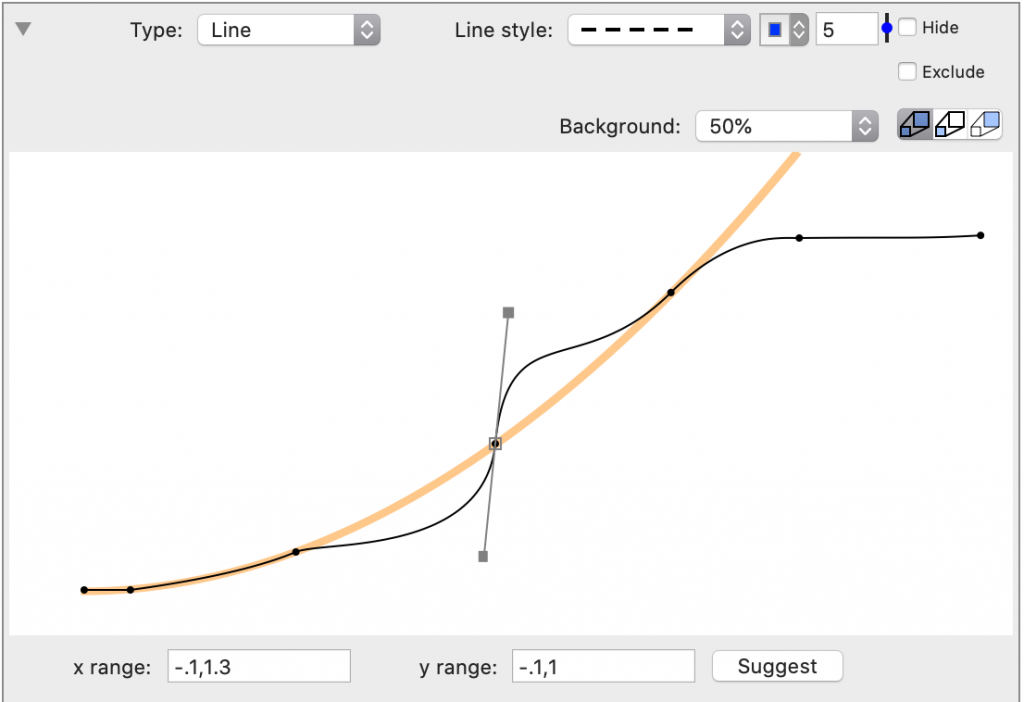
Changes in the Freehand command are updated live in the graphic.