How to Add a Legend
A legend is a key that on a graphic that provides a reference for multiple datasets on a graph.
DataGraph has three commands that add different types of legends:
- the Legend command,
- the Custom Legend command, and
- the Color Ramp Legend command.
Add a Basic Legend
To add a legend:
- Select Command\Add Legend from the menus, OR
- Click the Legend shortcut in the toolbar.

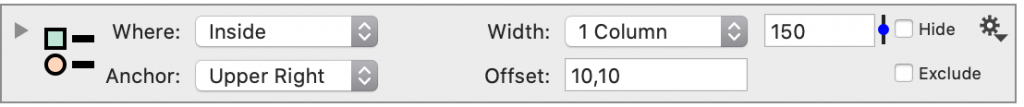
The Legend command is added to the interface, with settings for the location and look of the legend.
Edit Legend Names
Unlike most commands that are independent from each other, the Legend command gets its input from other commands. Thus, the legend name is stored in each drawing command listed in the legend.
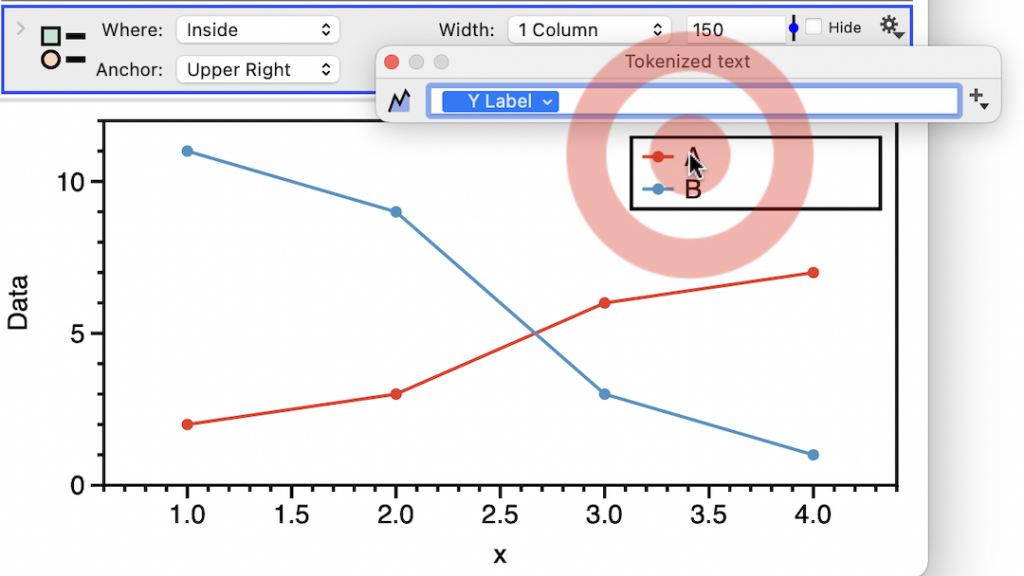
For example, here is a Plot command that is expand to show the Legend name entry box.

The blue pill shaped box in the text entry box is a token that will display the name of the Y column. You can delete the token and type a new name, or combine text and token(s).

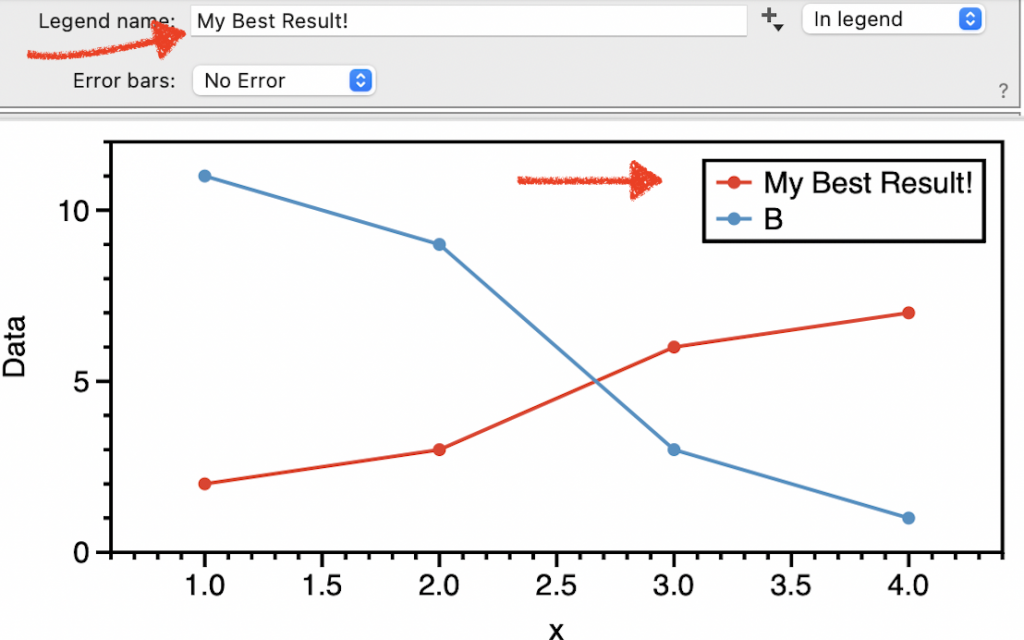
To edit directly from the graph, double click on a legend entry and begin typing.
Either way you edit, the text you enter is stored in the command.
For more information, see the Legend command documentation.
Add a Custom Legend
Items included in a custom legend are specified manually. This gives you more control than the standard Legend command.
The Custom Legend command is used:
- to customize legend entries, or
- to add a color scheme or marker scheme variable.
Fore more details, see the Custom Legend documentation.
Add a Color Ramp Legend
The Color Ramp Legend is used to show a color ramp along the side of a graph.
The color ramp is a variable that can be used to any command that also has a color scheme option.
To add a color ramp legend:
- Select Command\Add Color Ramp Legend
- On the command, use the menu to select the legend to display.
- Customize the location and width of the color ramp.
For more information, see the Color ramp legend documentation.