DataGraph
-
Getting Started
-
User Interface
-
Data
-
Columns
-
Variables
-
Commands
-
Layout settings
-
Customize
-
Functions
-
Exporting
-
Scripting
-
Beta
-
Versions
-
Join the Community
Print
Paired t-Test
Updated
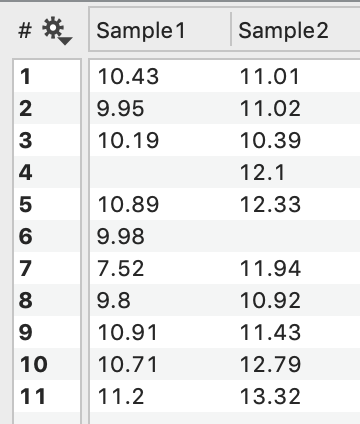
Sample 1: 10.43, 9.95, 10.19, 10.89, 9.98, 7.52, 9.8, 10.91, 10.71, 11.2
Sample2: 11.01, 11.02, 10.39, 12.1, 12.33, 11.94, 10.92, 11.43, 12.79, 13.32
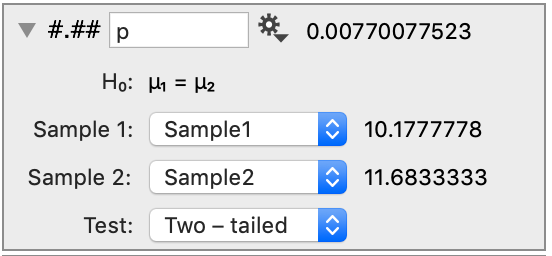
Input
Samples
Select a column of data for Sample 1 and Sample 2.
Once selected, the mean is calculated and shown the right of the menu.
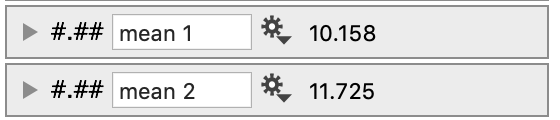
NOTE: The columns do not need to be equal in length but entries are omitted when they are not paired in a given row.
Thus, 9.8 in Sample 1 and 12.1 in Sample 2 are omitted from the test. As a result, the mean of the entire column does not match the mean shown on the t-test.
Test
Choose between a two-tailed test and a one-tailed (one-sided) test.
Output
The output is the p-value.
On This Page