Graphic
The Graphic command allows you to add an image or other graph as a static image.
Some examples of what you can do with this command are:
- Combine graphs and images.
- Add a logo in a corner of a graph.
- Composite multiple graphs into a figure. Each graph can be created in a separate graph in DataGraph and remain dynamic or just pasted.
- Scale bitmaps. Applications like TextEdit don’t have control over the output size, and DataGraph can scale a bitmap to an exact size.
- Copy and paste an equation created in LaTeXiT or some other equation editor. DataGraph supports typesetting basic mathematical expressions but doesn’t have the full functionality you get with LaTeX.
- NEW DataGraph 5.3 – Generate QR codes.
Create an empty graphic command using the Label menu from the toolbar or Command > Add Graphic from the menu bar.
Drag and Drop
A quick way to create the graphic command and populate it with an image is to drag and drop it into the command list.
Tip: You can also paste images from the clipboard into a graph.
Files
Here, you can see how to drag and drop from the Finder.
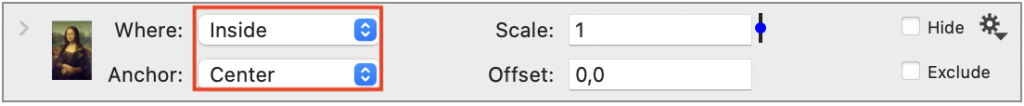
By default, the image will be located ‘Inside’ the axis rectangle and anchored in the ‘Center.’
If you expand the command, you will see a preview and the exact size of the imported image in pixels.
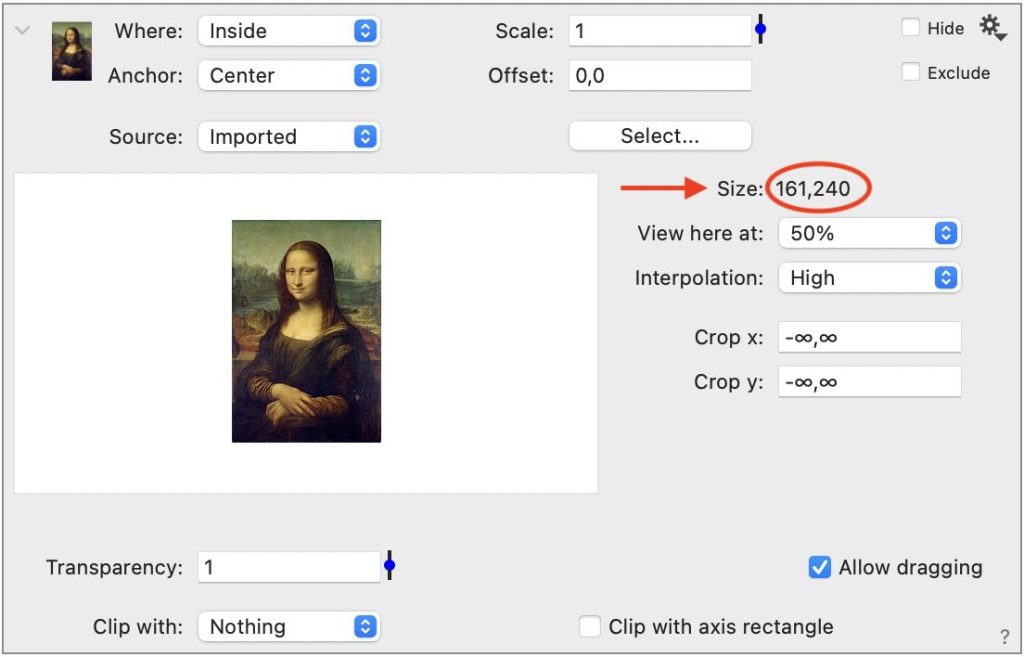
Once the image is imported, you can position and scale it.
Thumbnails
You can drag and drop using thumbnails to combine graphs.
Here, two graphs with different axes are combined into a single image.
Source
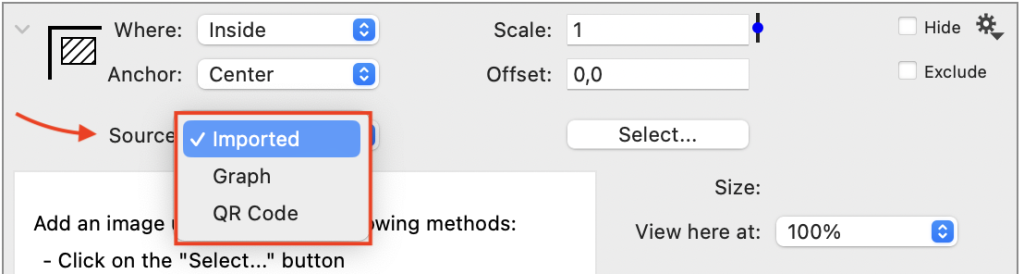
The Source menu provides three ways to specify a graphic.
- ‘Imported’ – from a file such as a jpeg or png.
- ‘Graph’ – specifying a graph in the same DataGraph file.
- ‘QR Code’ – create an image that is a QR code.
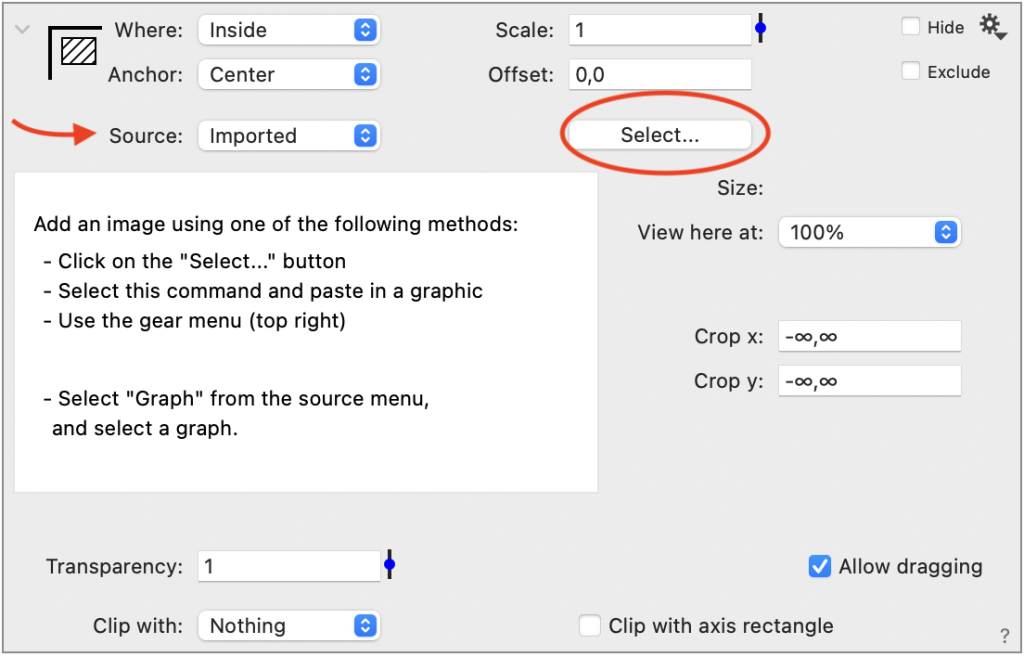
Imported
The default setting for the source menu is ‘Imported.’
Click Select… to open the Finder and select an image file (e.g., jpg, png, … ).
You can also copy the graphic back into the clipboard. This is useful since DataGraph retains any LinkBack information. For some applications, such as the equation editor, LaTeXiT, you can paste it back into the application and continue to edit.
Graph
When Source is ‘Graph,’ you will see thumbnails of all the graphs in your file just below the Source menu. Click on a graph to select it.
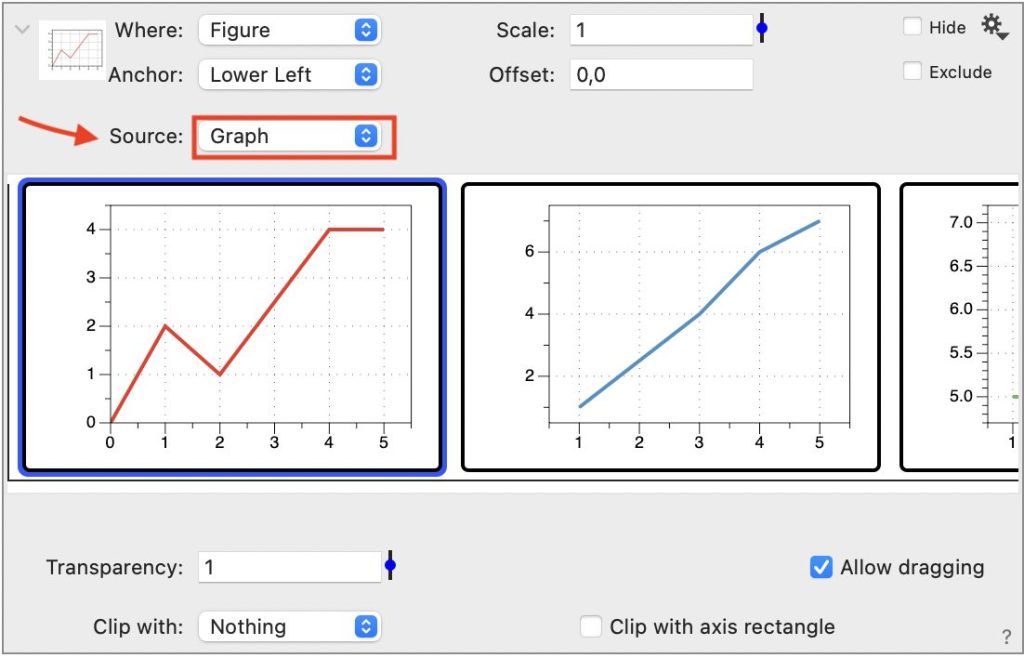
You cannot select the current graph or that directly depends on this graph.
To create a blank canvas for composing graphs, select File > New Graph > For Composition.
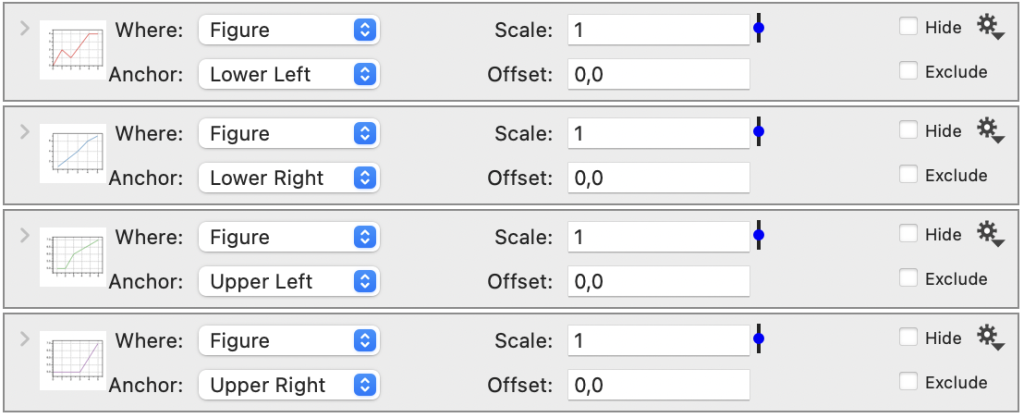
To combine multiple graphs, you can use multiple Graphic commands.

QR Code
Here’s how to generate a QR Code:
- Set the Source to ‘QR Code.’
- Enter a URL address in the Content text box.
- Click the icon to the right of the text box to test the URL.
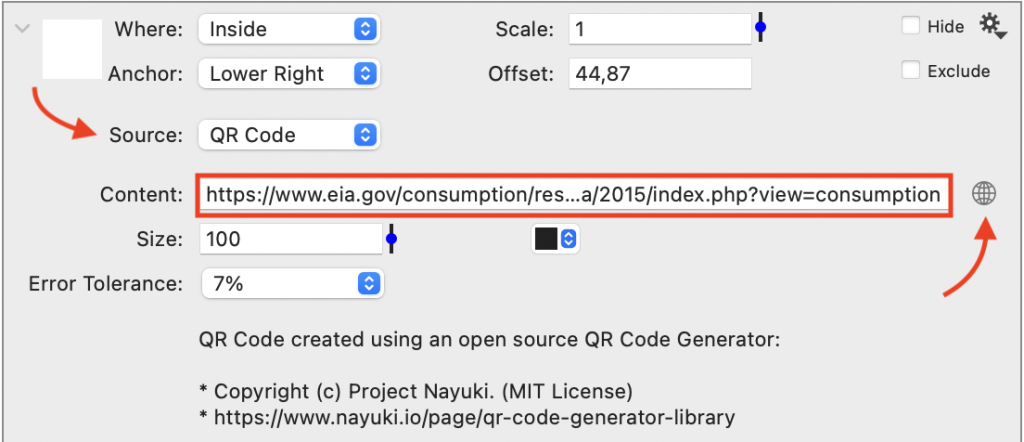
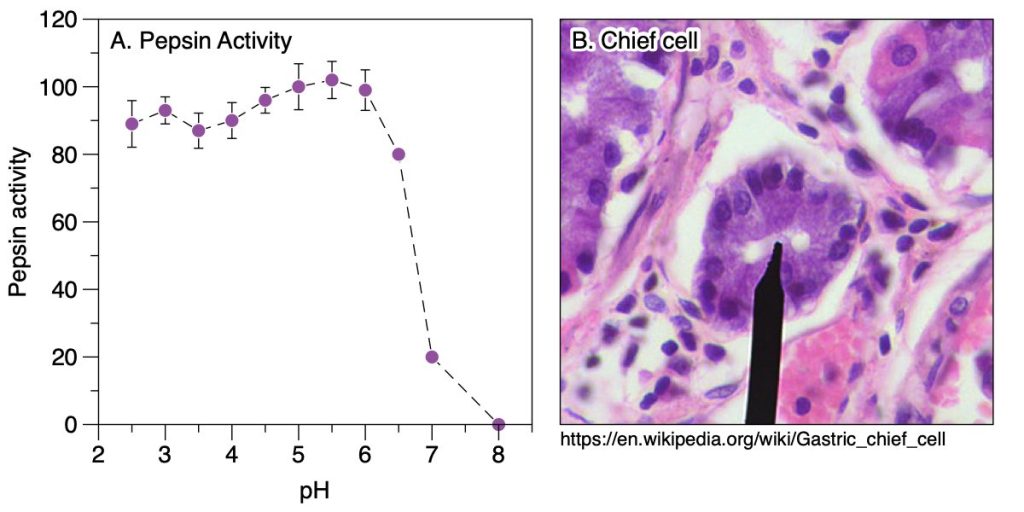
This can be useful for creating infographics. In this graphic, the QR code for the source data is shown in the lower right corner.

Where
The Graphic command has lots of options for how you position the graphic.
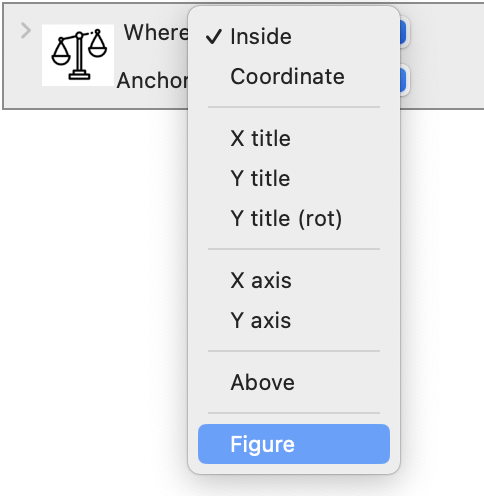
Use the Where to menu to select the overall location of the graphic. By default, this is set to ‘Inside’ the axis rectangle.
‘Figure’ lets you place an image relative to the entire extent of the graph, and therefore not dependent on an axis.
You can also position the graph in the title or along the axes. For example, if you want a graphical label instead of a text label.
The option you pick should depend on what should happen as the data changes and you resize the graph.
Anchor
The options in the Anchor menu change depending on what is selected in the Where menu.
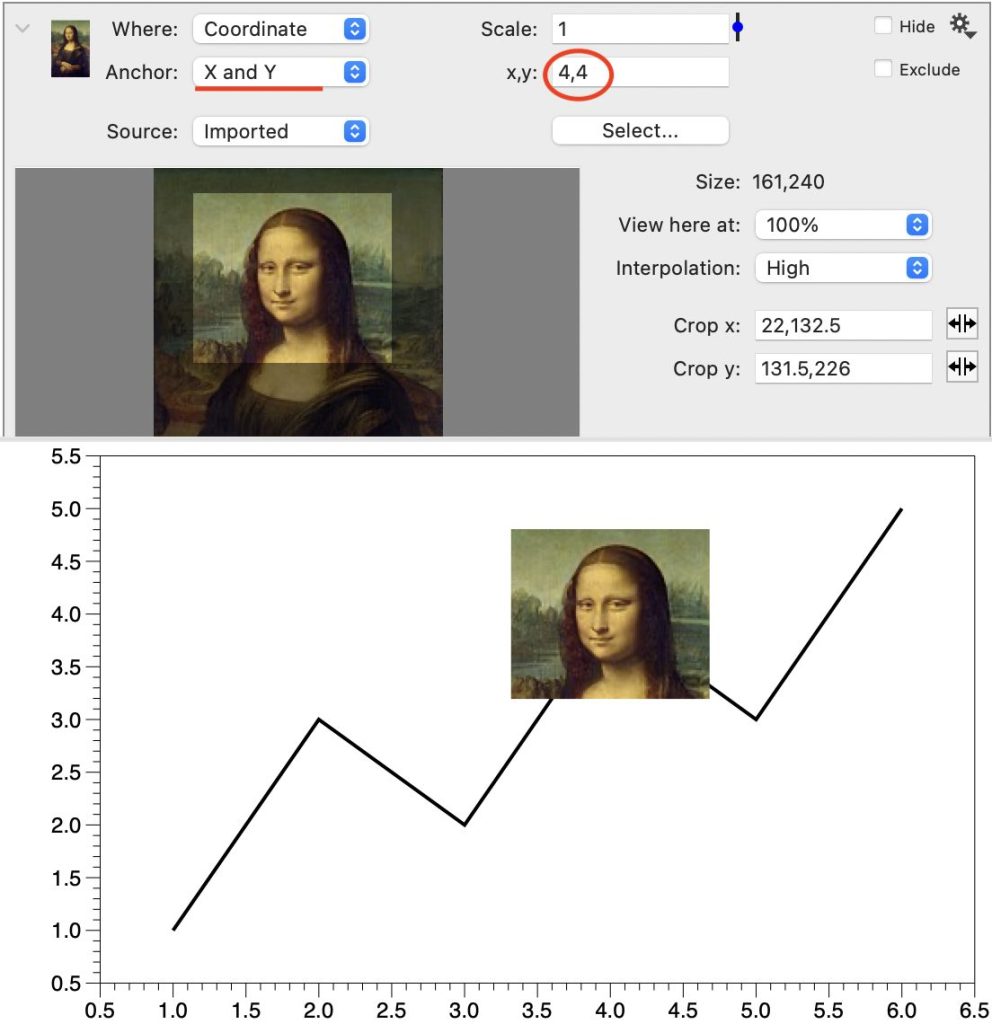
For example, for Where set to ‘Coordinate’, use the Anchor menu to pick which axes you want to use to locate the image.
Here, a cropped image is anchored at (4,4).
Crop x/y
You can crop an image in the x or y direction. Type in the exaction crop region where (0,0) is the bottom left corner of the image.
To interactively crop, click and drag on the image preview.
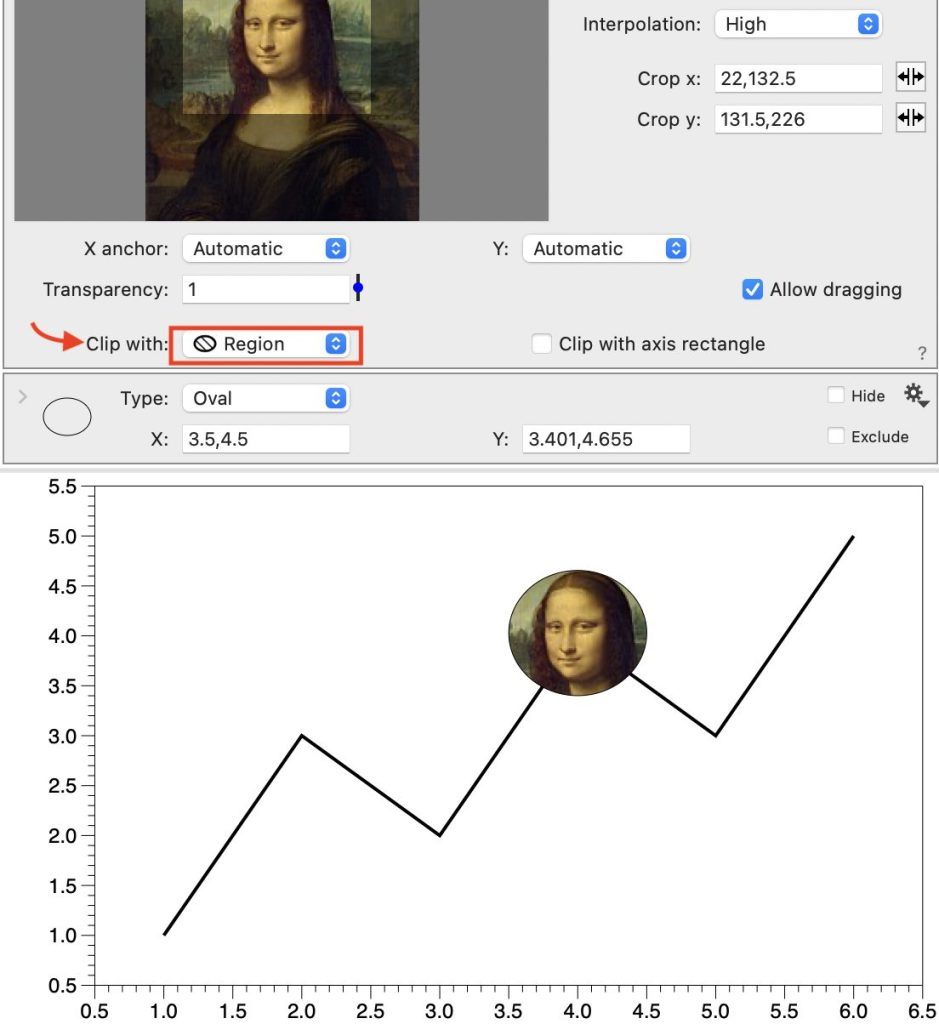
Clip with …
At the bottom of the command are options for clipping the image. You can clip with the axis rectangle or use another command to clip the image.
Here, the image is clipped with a Region command.