Function
The Function command draws analytic functions in the form y as a function of x or y = f(x). You can also use variables to explore how a function changes with different inputs, create animations, etc.
Use the command to draw a function continuously over a specified range of x values. You can also draw piecewise functions using logical statements (i.e., if(TEST, TRUE, FALSE).

Entry Box
Use the Draw icon in the toolbar or select Command > Add Function from the menu bar to add a Function command.
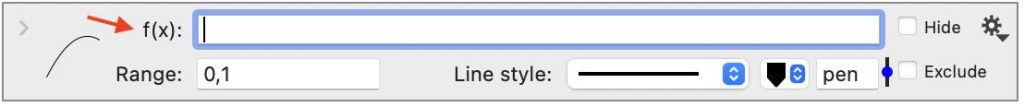
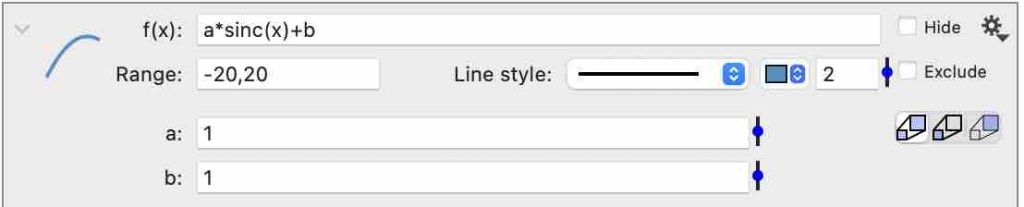
After you add the command, you will see the following object with an entry box at the top. Here is where you can type in a function.
Create expressions using:
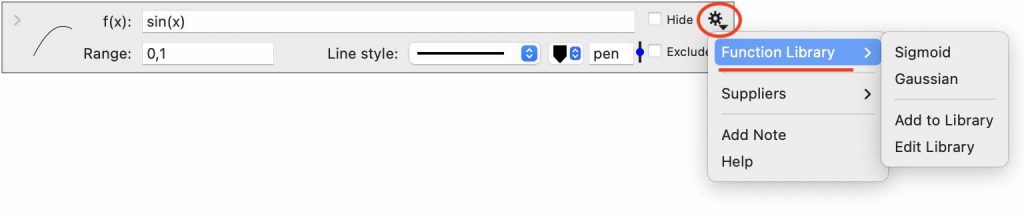
If you add functions to your custom function library, you can select them using the gear on the top right. In the example below, two custom functions have been added: Sigmoid and Gaussian. You can also add functions to the library from this gear menu.
Range
By default, the x-range of the function is set to (0,1).

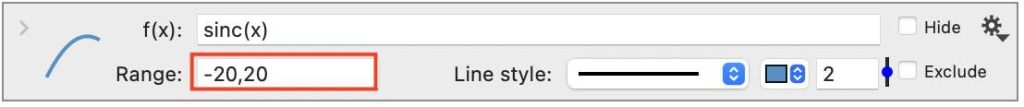
Use the Range entry box to change the extent of the function.

You can also change the line style, color, and thickness. These changes are reflected on the custom icon, on the left of the command.
Variables
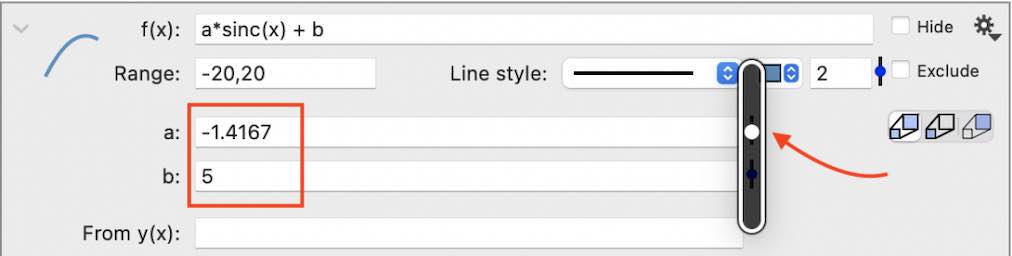
If variables in your expression are not defined using global variables (e.g., Slider or Value variables), the variable name and an entry box will be added to the command.
For example, this function has two unknown variables, a and b. By default, they are given a value of one.
You can type in numeric values, use the sliders to vary, or enter the names of global variables. Here b was given the value of 5, and a is varied using the slider.

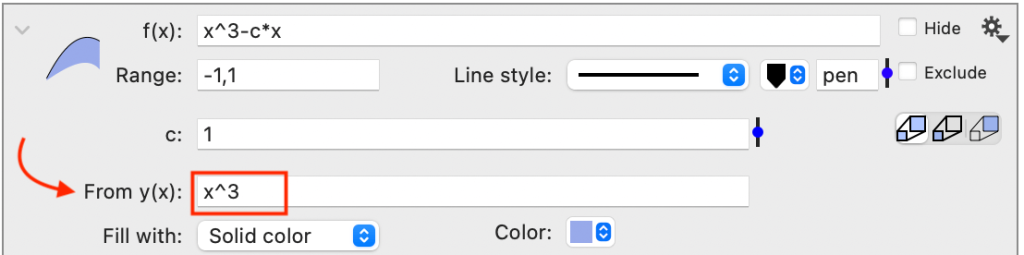
Fill
Use the Fill with menu to add a fill of varying styles. By default, the fill is drawn from y(x)=0, equal to zero.
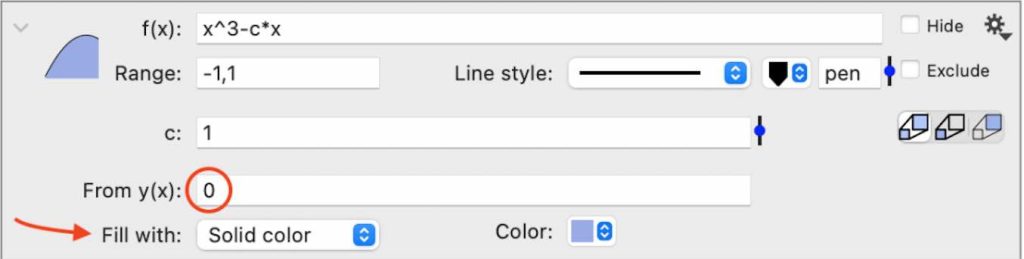

You can also specify a function that the fill is drawn to.

Include
When you enter a value in the Include in y entry box that is not currently in the y range, the axis limits will extend to include that value.
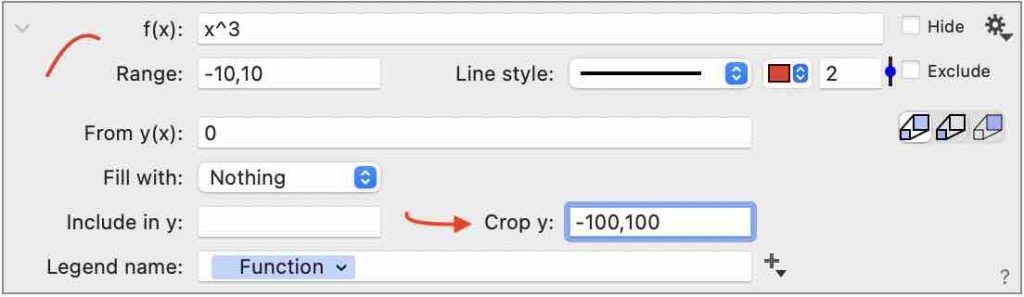
Crop Y
The Crop Y entry box contains the minimum and maximum y values drawn. By default, they are set to -∞, ∞. Use this option to limit the extent of the y range, without changing the x range.
For example, here is a graph of x^3 over the x Range (-10,10). Notice that the y range extends from (-1000,1000).

Below the Crop y range has been set to limit the y extent to (-100,100). This does not change the range shown in the x direction.

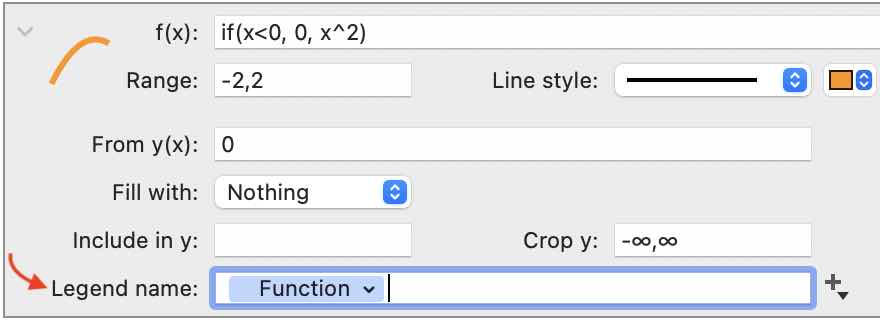
Legend name
The Legend Name entry box is at the bottom of the command. The contents of this box are shown when you add a Legend command.
By default, it is set to a Function token that displays the expression.

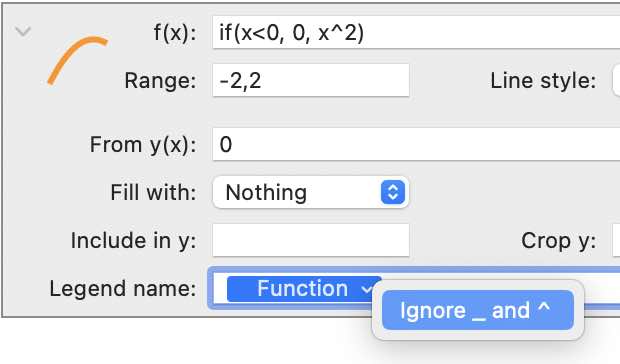
By default, the text is formatted such that any characters beyond a caret symbol (^) are superscript and after an underscore ( _ ) are subscripted. If you want these characters ignored, click on the token and select Ignore _ and ^.
Function Token
The Function Token can be added to any text box in the graph.
For example, add it to the Title in the Canvas settings. Click to the right of the Title entry box. You will see a list of available tokens, including any expressions drawn with a Function command.
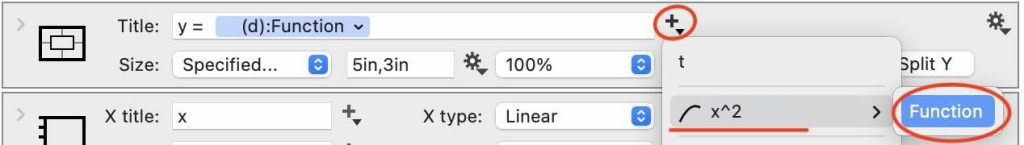
The function token only shows the expression as entered. You can combine it with other text, as in this example.
