-
Getting Started
-
User Interface
-
Data
-
Columns
-
Variables
-
Commands
-
Layout settings
-
Customize
-
Functions
-
Exporting
-
Scripting
-
Beta
-
Versions
-
Join the Community
Magnification
This command allows you to zoom in on a portion of the graph. Sometime referred to an an inset in a graph.
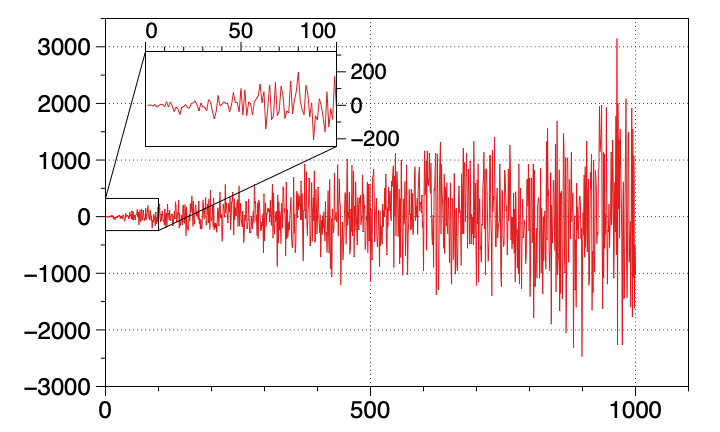
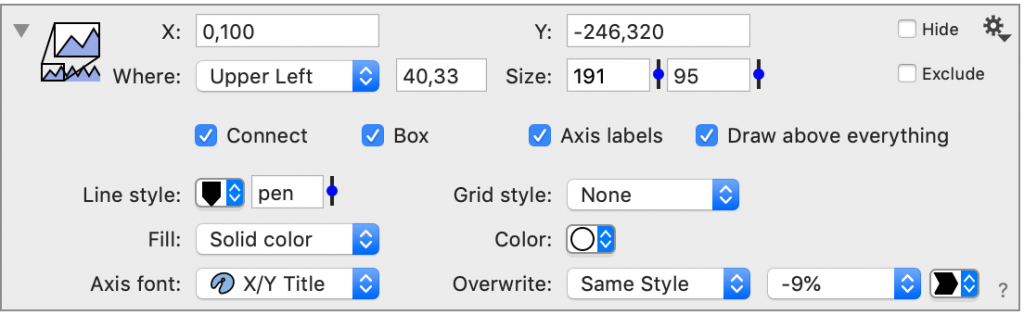
You can drag the source and destination rectangles using the mouse or specify them exactly. The source is in axis coordinate and consists of two intervals. The destination is in terms of pixels.
For the destination you specify the anchor, offset from the anchor and height/width of the new area. The size of the destination area does not include the axis labels, just the portion where the magnified portion is drawn.
If the range specified in the magnify command is larger than the cropping region the inset view has a larger domain than the drawn view. To reflect that a small rectangle is drawn inside the magnified portion which represents the cropping region.