How to Import Data
When you import data into DataGraph, the program will interpret your data files to identify column separators, column headers, and determine data types for each column.
To import a file, click on Data > Import File on the menu bar to select a file from the Finder. You can also Drag and Drop a file, as shown below.
- Copy and Paste
- Drag and Drop
- Importing from the Finder
- Right-clicking on CSV or Excel files in the Finder
See File Formats for a description of the file you can import.
File Formats: Some file formats such as CSV contain data in a tidy format, and are easy to import. Other formats such as spreadsheets are often messy, requiring data manipulation to be in the proper format.
DataGraph has many built-in actions to help tidy your data including:
You can also filter your data dynamically using Masks, so you don’t have to spend a lot of time rearranging and preparing data before you import.
When the default import settings are not quite right, try Paste Special to customize the import settings or Import Special to create a custom data parser.
Copy & Paste
In this example, we will paste data into a new file.
To create a new file, click the ‘New File’ button on the Example files window (bottom right), or select File > New (⌘-N).
Try with the following data table. Click and drag to select the data, then select Edit> Copy (⌘-C) in the menu of your browser. That will place the data in your clipboard.
| County | Population |
| Asia | 4,298,723,000 |
| Africa | 1,110,635,000 |
| Europe | 742,452,000 |
| North America | 565,265,000 |
| South America | 406,740,000 |
| Australia | 38,304,000 |
| Antarctica | 4,490 |
In a new DataGraph file, select Edit > Paste or control-click on the data table and select Paste (⌘-V).
Two columns are created, the column headers are automatically entered, and the data type is properly assigned.
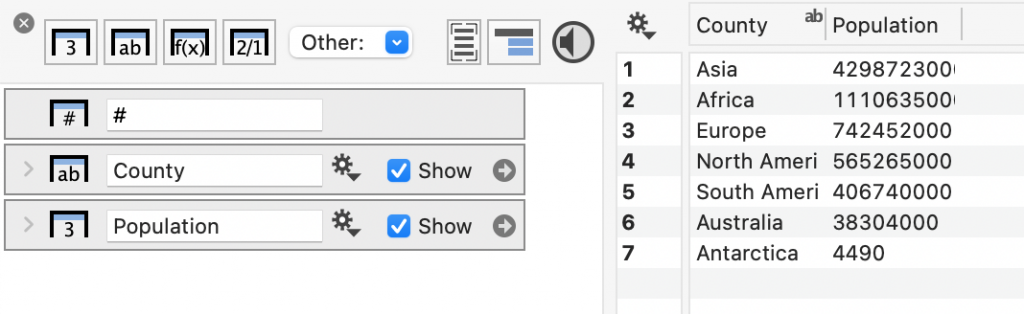
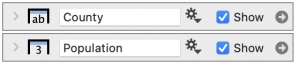
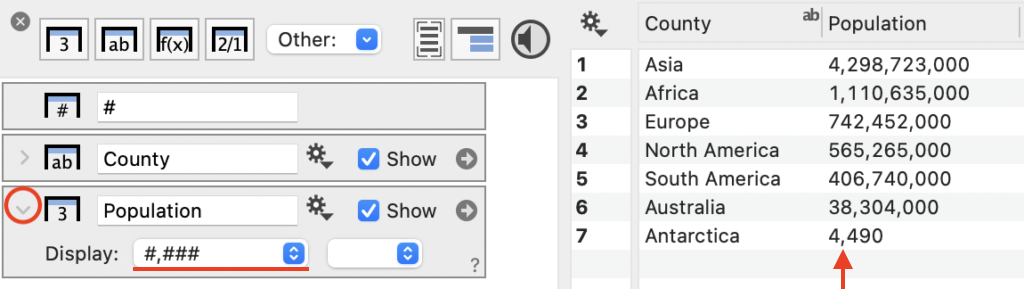
The icon on the left of the column object indicates the data type. In this case, the ‘Country’ column is imported as text and the ‘Population’ is a number.
To make the columns wider, hover the cursor over the dividing line between the columns. Click and drag to change the width.
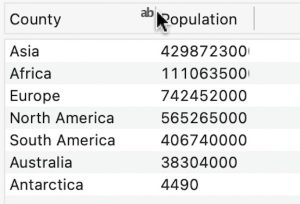
After increasing the column width, the data looks as follows. Note that the comma separators for the thousands place were removed when we pasted the data.
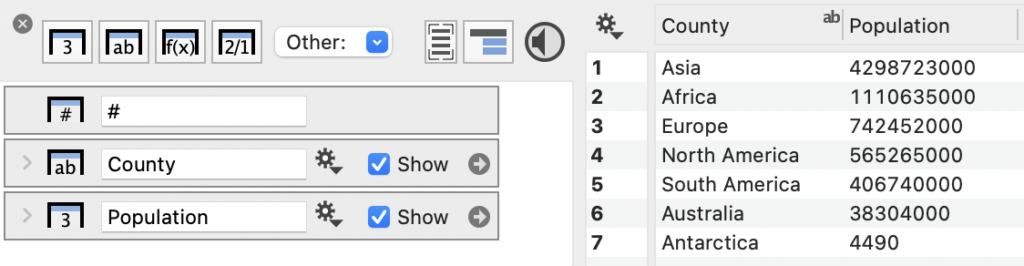
To display the comma separators, click the left corner of the column object for the ‘Population’ column (disclosure triangle) to expand the object. Change the Display menu to ‘#,###’.
Drag and Drop
Drag and drop is a quick way to import data from one or more selected files on the desktop or in the Finder. Every file format that DataGraph understands can be imported using a simple drag and drop.
Drag and drop onto the data table to import columns without a group.
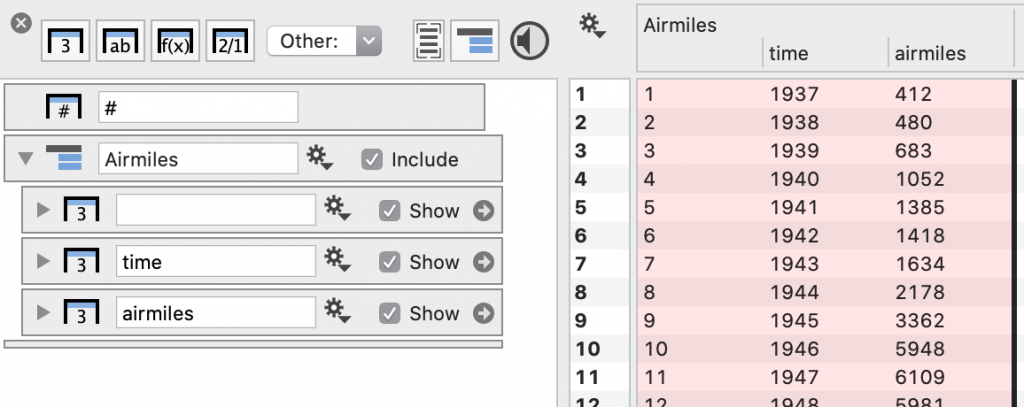
Drag and Drop onto the column list to import as a Column Group. The group name is set equal to the file name. Expand the group to see the columns listed.
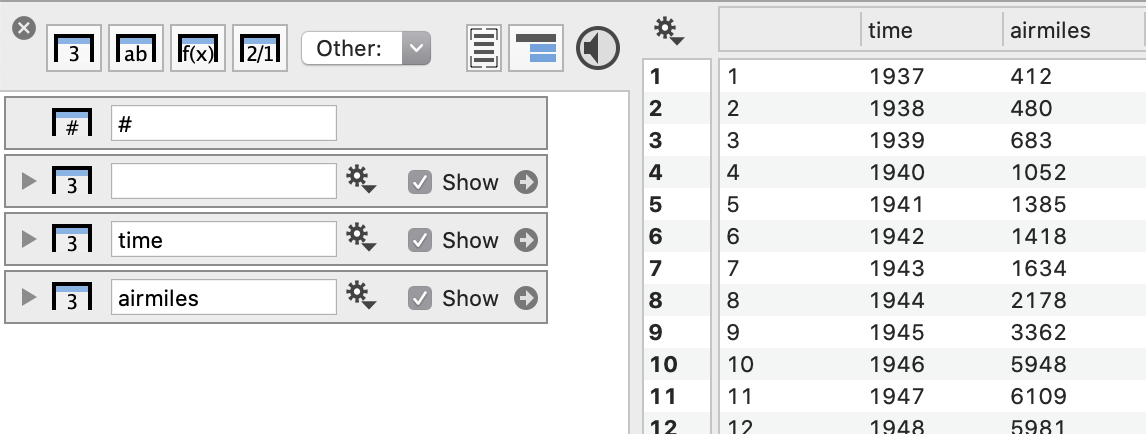
Here is what the data looks like when it is ungrouped, where each column has a corresponding object on the left.
Here is what the grouped data looks like, where the objects in the column list are surrounded by the group object and have a shaded background in the data table.
Column Groups: DataGraph uses Column Groups to organize data. Groups are similar to sheets in a spreadsheet, but have many advantages including:
- Nest groups within groups,
- View multiple groups at once,
- Easily hide a group from view, and
- Click and drag to reorder groups.
Select from Finder
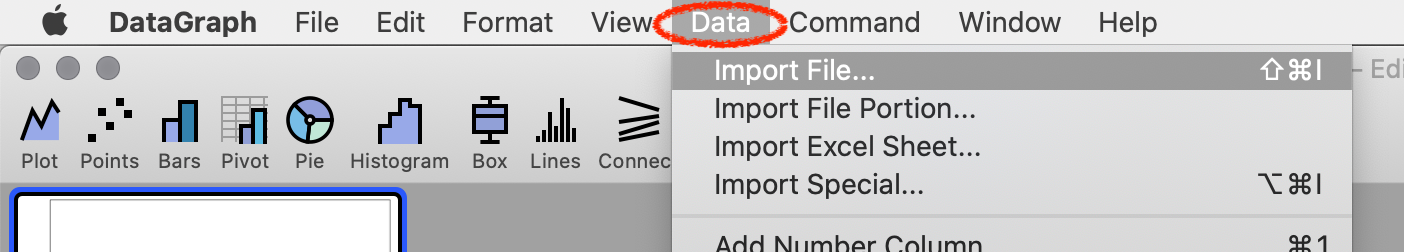
To select a file using the Finder, click on the Data menu …
or click the gear menu on the top left of the data table.
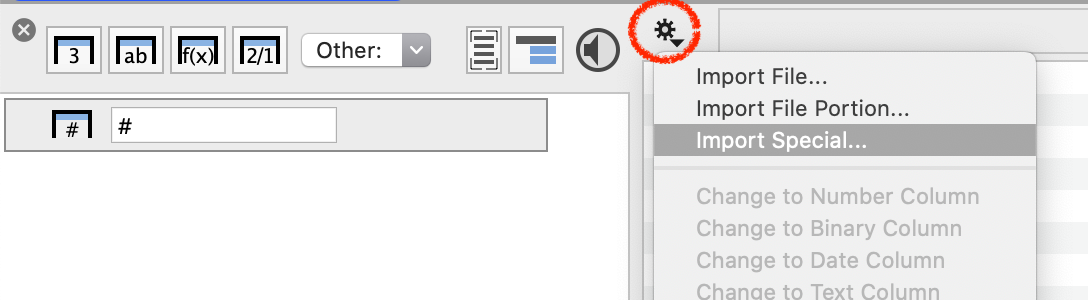
From there, you can access several import options including:
- Import File (or type Shift-⌘-I )
- Import File Portion
- Import Excel Sheet
- Import Special (or type Option-⌘-I )
Import File
Select this option (or type Shift-⌘-I ) to open the Finder menu to select a file. The selected file will be imported in the same way as using drag and drop.
Import File Portion
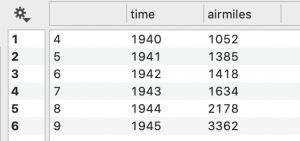
Select this option to access a simple interface to select rows to import. Click and drag to select multiple rows. Use ⌘-Click to select individual rows.
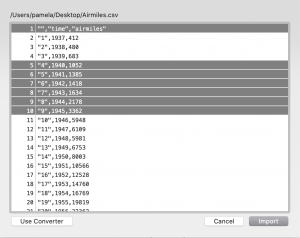
Only the rows selected are imported.
Import Excel Sheet
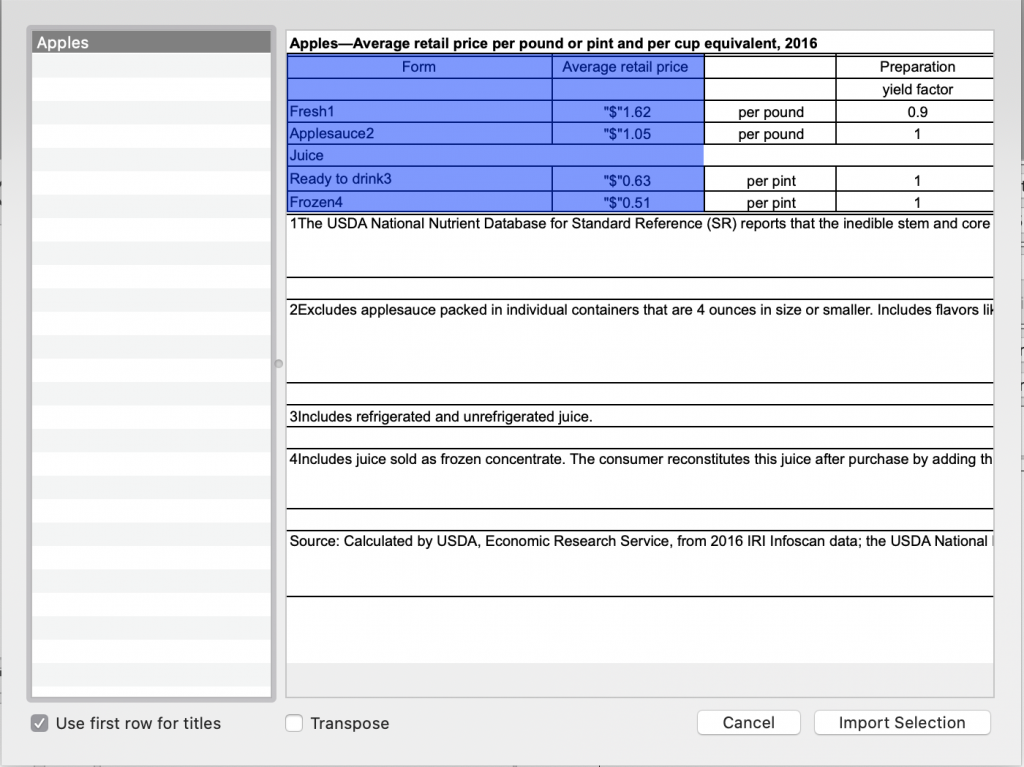
Select this option to get a preview of an Excel file, and an interactive interface to click and drag a section to import.
NOTE: You do not need to use this option to import from excel. Excel files can be imported using drag and drop, just like any file format that DataGraph understands.
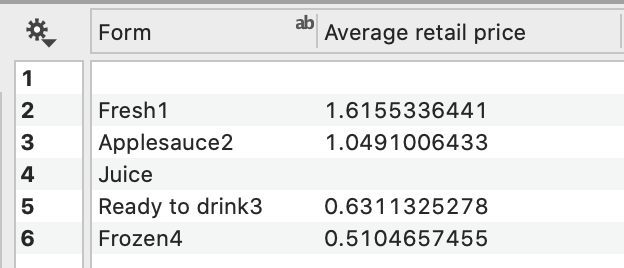
The selected cells are imported.
If a file has multiple sheets, they will be listed on the left side of the importer. You can only import from one sheet at a time.
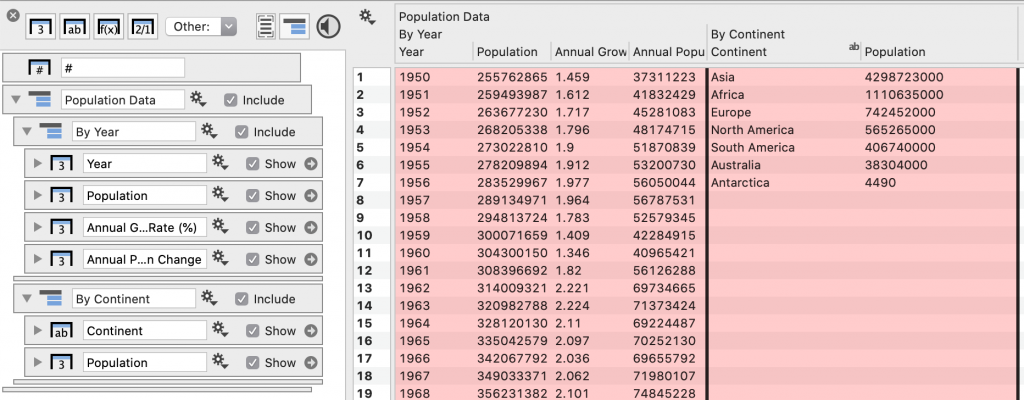
NOTE: If you have multiple sheets, a quick option is to drag and drop on the column list. A group is created using the Excel file name. Each sheet becomes a nested group.
Import Special
The Import Special option allows you to preview your data while specifying how the data should be imported.
This interface is itself a small program within DataGraph that has a lot of powerful functionality to create custom data import methods, or data parsers, that can be saved and reused.
To learn more see How to Create an Import Method.