-
Getting Started
-
User Interface
-
Data
-
Columns
-
Variables
-
Commands
-
Layout settings
-
Customize
-
Functions
-
Exporting
-
Scripting
-
Beta
-
Versions
-
Join the Community
How to ‘Flatten’ Data
In DataGraph, you can reverse pivot, or flatten a data set quickly using the menu option Data/Flatten Columns.
Why Flatten?
Data tables can be configured in two general formats: (1) a wide format with lots of columns or (2) a long format with less columns and more rows.
By converting the data to a long or flattened format, the data resides in fewer columns and can be more easily manipulated using commands, such as the Pivot command. Having a long table with few columns, allows you to query and parse the data a lot faster.
Flattening increases the performance and scalability. The flattened format is also more general. Data can be added without changing the data structure (i.e., adding more columns). Drawing commands that use that data also do not need to change when we add more data.
Example
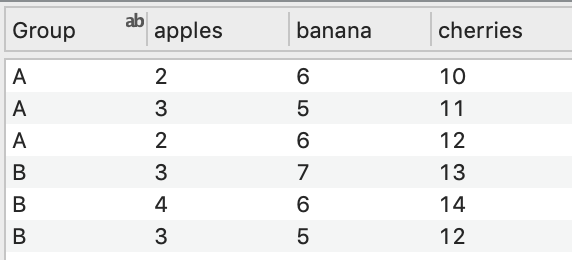
Here is an example of data spanning multiple columns, a ‘wide’ format.
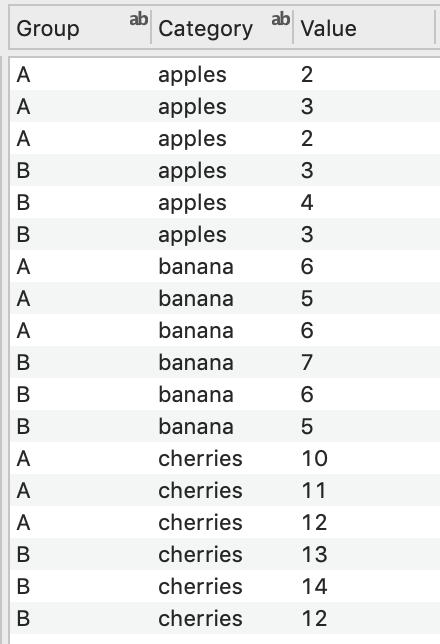
Here is the data after is has been flattened, a ‘long’ format.
Step 1: Select the columns you want to flatten (e.g., apples, bananas, cherries).
Step 2: Select Data/Flatten Columns
Using this format has a lot of advantages for analyzing data, as many commands in DataGraph work best when the data is in one column.
Video Demo
To view an example using a much larger dataset, see the following demo. The link shows the flattening of a population dataset at 5:11 in the demo.