Customize the Toolbar
DataGraph has a toolbar across the top of the interface with access to commands, shortcuts for adding notes and groups, a loupe tool, a shortcut to toggle the data side panel, and the Add Graph shortcut.
Draw and Label Menus
Click these buttons for a drop-down list of all the graph elements or drawing commands.
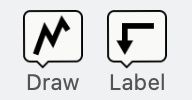
The Draw menu contains commands that work with data (plot, points, histograms, …). The Label menu contains commands for annotating your graph (labels, legends, regions, …).
To the right of Draw and Label, there are several shortcuts for commonly used commands.
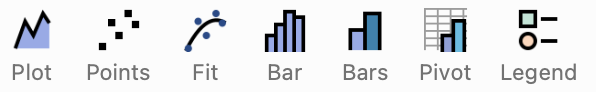
You can also get a full list of commands from the Command menu.
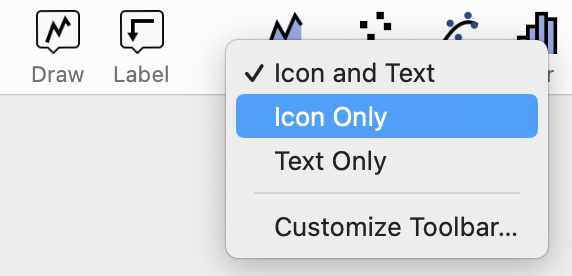
Menu Icons
By default the toolbar contains the Icon and Text for each item in the toolbar. You have the optoin of showing the Icon Only or Text Only. To customize the toolbar, control-click on the bar.
Add or Remove Shortcuts
A group of commonly used commands and shortcuts are in the toolbar, but you have the option of adding an icon for any command/shorcut you want in the toolbar.
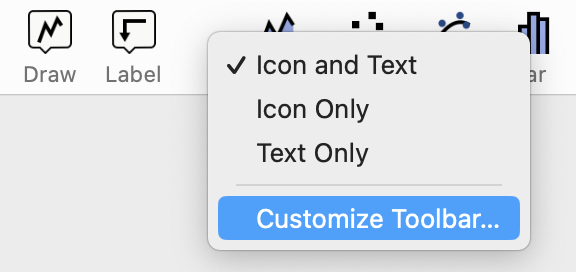
To add or remove items, control-click anywhere on the toolbar and select ‘Customize Toolbar…‘
An interactive display showing all the commands in DataGraph drops down from the toolbar.
- To add items, click the icon from the display, and drag it to the toolbar.
- To remove items, click the toolbar icon and drag it to the display.
Both are demonstrated below.
NOTE: This demo uses DataGraph 4.0, but the process works the same in later versions.
Restore Toolbar
When you change the toolbar, it is changed for any file you open. You can restore the original toolbar by dragging the default set into the toolbar, as shown below.
NOTE: This demo uses DataGraph 4.0, but the process works the same in later versions.

Hide the Toolbar
You can also hide the toolbar by selecting View > Hide Toolbar.
Restore the toolbar using View > Show Toolbar.