Custom Legend
The Custom Legend command allows you to create a legend manually, and has many options beyond the default Legend command.
To add, select Command > Add Custom Legend.
Legend vs. Custom Legend
The Legend command automatically derives the legend entries based on the commands in the graph. You can customize the names and order of the entries, but the actual symbols and colors are generated automatically.
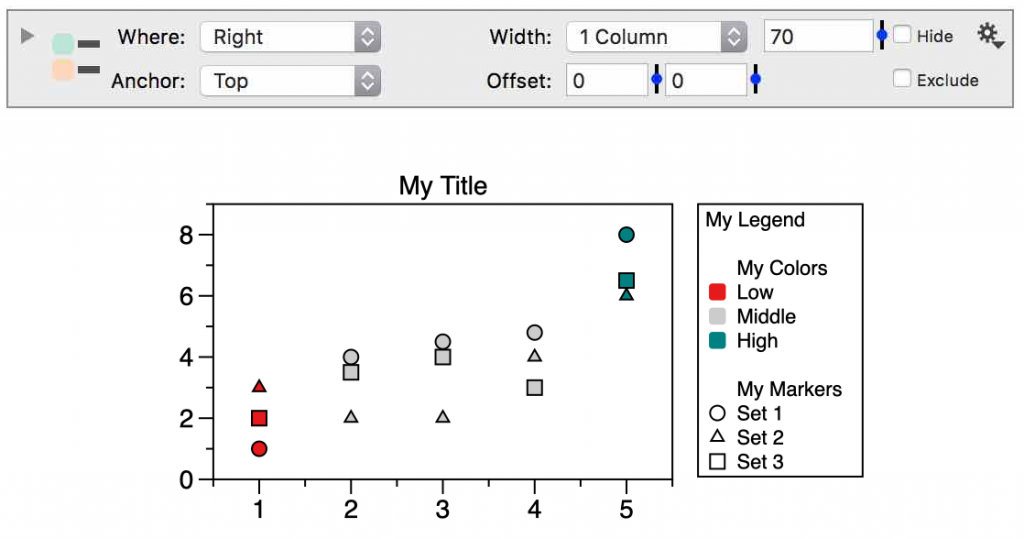
In the Custom Legend, you have complete control over the legend content. For example, you may want to specify which commands to include, specify exactly the symbols and colors the legend will display, or add titles or group the legend entries in categories.
The Custom Legend is also the only way to display color and marker schemes for a graph.
Where
The location of the Legend relative to the graph.
Width
Set the number of columns for the legend and the overall width in pixels.
Anchor
Where the anchor point is located.
Offset
Enter an offset in x and y direction in pixels.
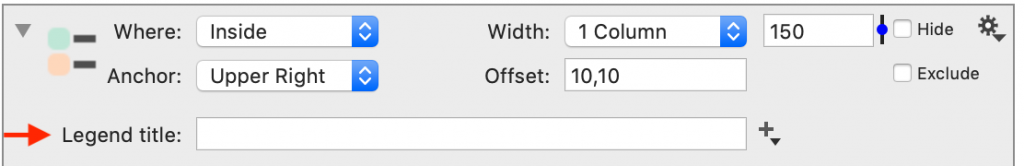
Legend Title
Enter an title that will go at the top of the legend.
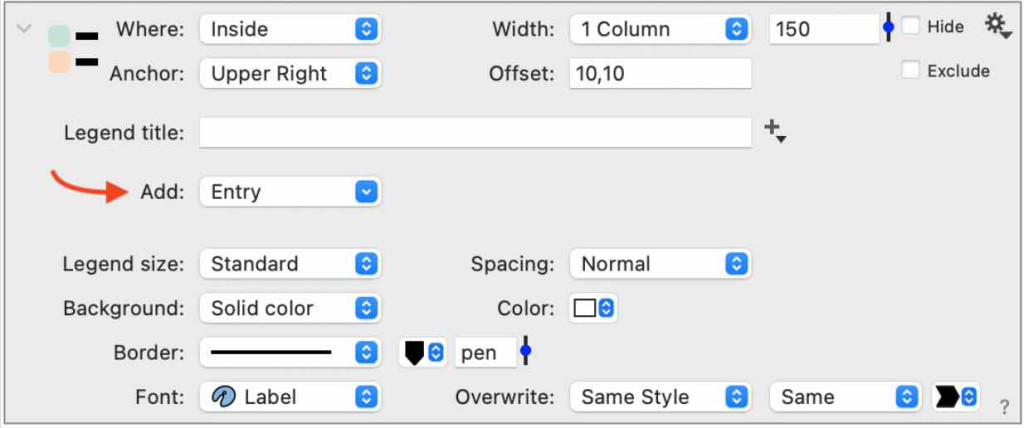
Add Entries
There are six different types of entries that you can add to the custom legend:
- Command – entries based on a specified drawing command
- Point – a point that you can customize
- Color – a color that you can customize
- Variable – the value for a variable including color scheme variables
- Pattern – a pattern that you can customize
- Text – a label that you can use as a divider between entries.
Use the Add menu select an entry:
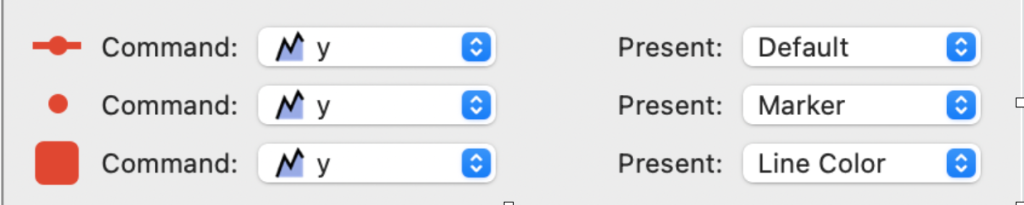
If you select Command, an entry is added where you can select from the commands in your graph. The Present menu gives you several options for what is displayed.
Below, the same Plot command has been selected three times, but different options are displayed. The default shows the line and marker, but you can show only the marker or line color. The text corresponds to the Legend text entry from the command, similar to the standard Legend command.
Legend size
The size of the legend entry. Increases the space between the symbol and the text.
Spacing
Controls the vertical space between items.