Color scheme
Color schemes allow you to map data to colors.
Color schemes also allow you to have a consistent color pallet across graphs, and easily change the color for every graph at the same time.
Color schemes can be used in the Points, Pivot, Pie, Box, Lines, Connect, Range and the Bar commands.
NOTE: This section shows you how to manually create and edit color schemes. You can also generate a color scheme quickly from a command by selecting ‘Create color scheme’ in the color menu.
Create a Color Scheme
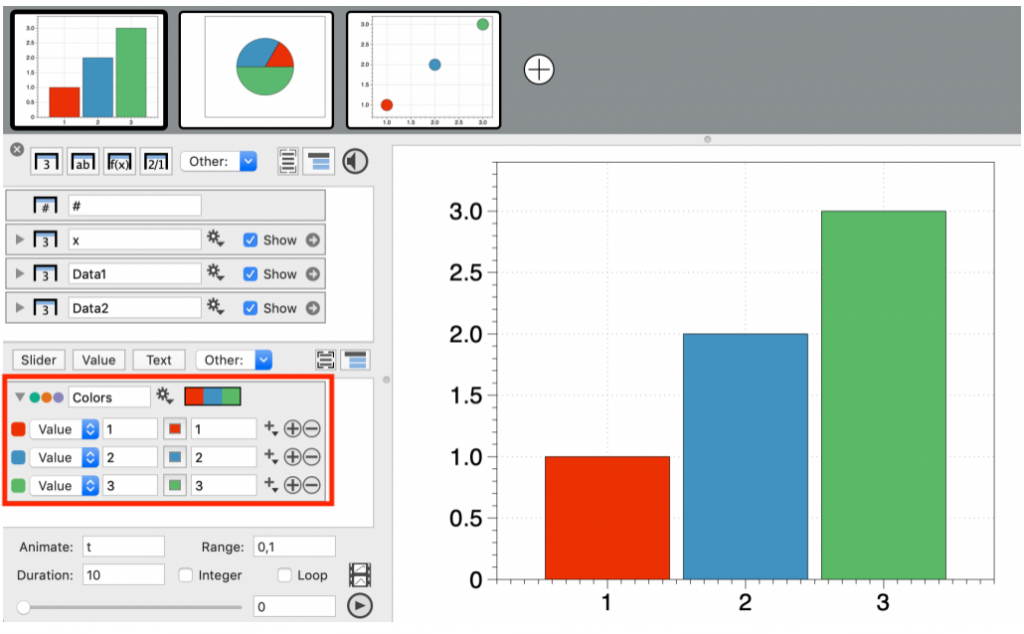
To create a simple color scheme, follow these steps:
- Select Color Scheme in the Other menu
- Add lines using the plus button
- Enter the match criteria (e.g., 1,2,3)
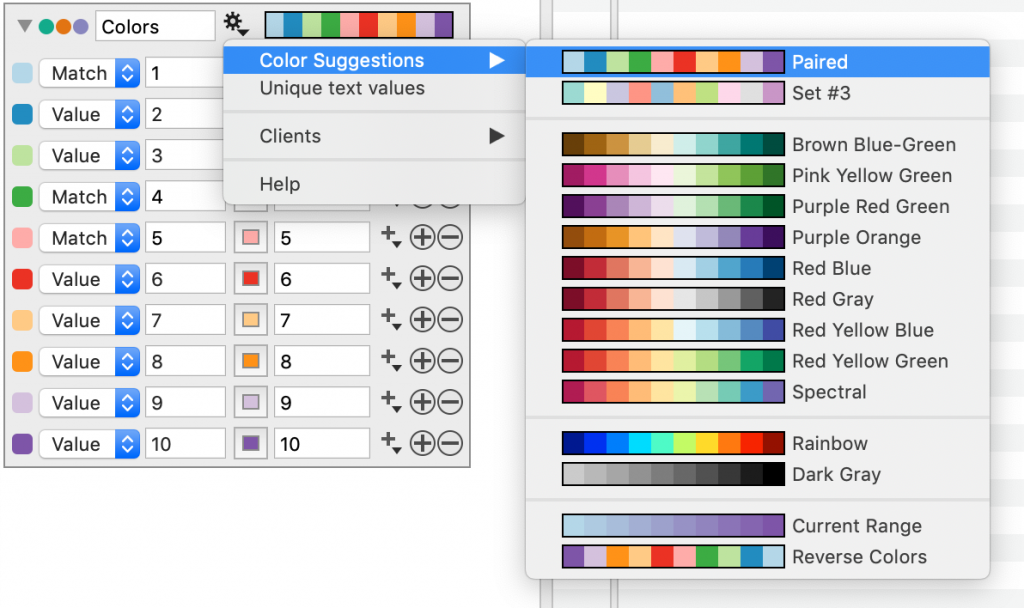
- Click on the gear menu
- Select Color Suggestions
NOTE: The color suggestions are from www.ColorBrewer.org by Cynthia A. Brewer, Geography, Pennsylvania State University.
Specify Data
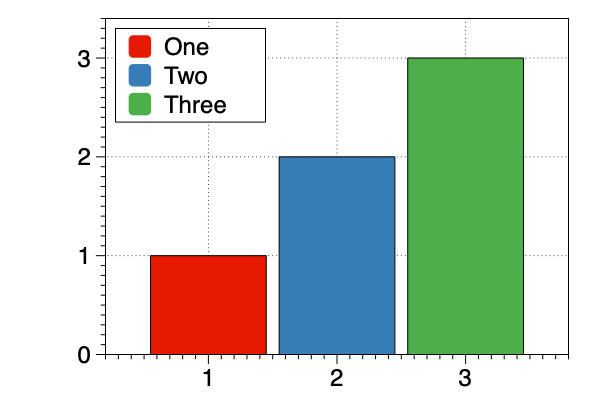
Each line specifies how to map data to a single color. Map colors to categorical data (text) or numerical values.
Match Text
Select Match and enter the text (or string match).
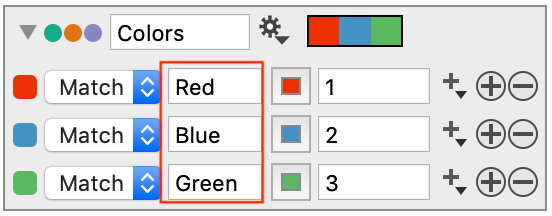
You can type exact text or use ‘*’ as a wildcard.
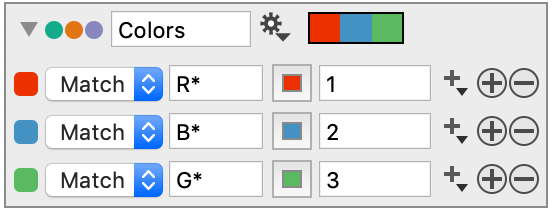
NOTE: The match is case sensitive.
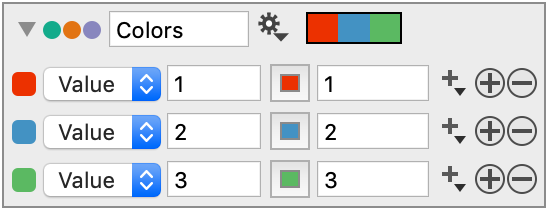
Match Numbers
For an exact match to a number, set the match criteria to Value and enter the number or variable.
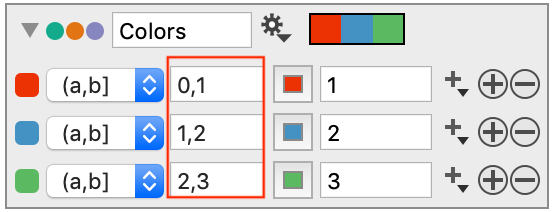
Range of Numbers
To match colors based on a range of values, there are several options, where:
- (a,b) = a < value < b
- [a,b] = a ≤ value ≤ b
Provide the min and max of the range.
To ensure that you don’t miss data above or below a range, use the infinity symbol, ∞ , for the beginning and end.
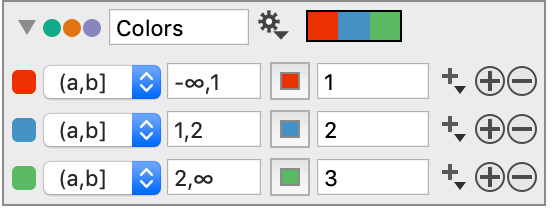
In the example above, the first group contains all values ≤ 1, and the last group is all values >2.
NOTE: Type Option-5 for the infinity symbol.
Specify Colors
Colors can be specified individually or use the color suggestions to change all the colors at once.
Individual Colors
You can specify each color in a color scheme.
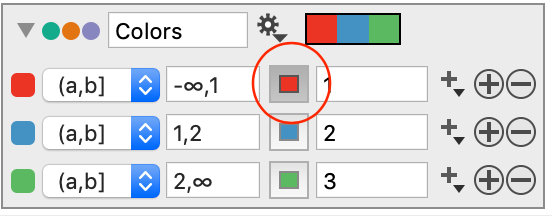
Step 1: Click the color tile.
Step 2: Choose from the macOS color picker.
Color Suggestions
You can change all the colors at once using the built-in color suggestions, available from the gear menu.
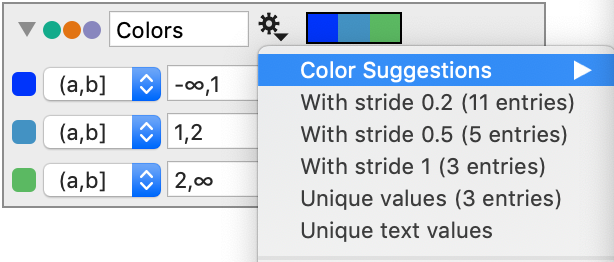
The number of suggested colors will correspond to the number of match criteria.
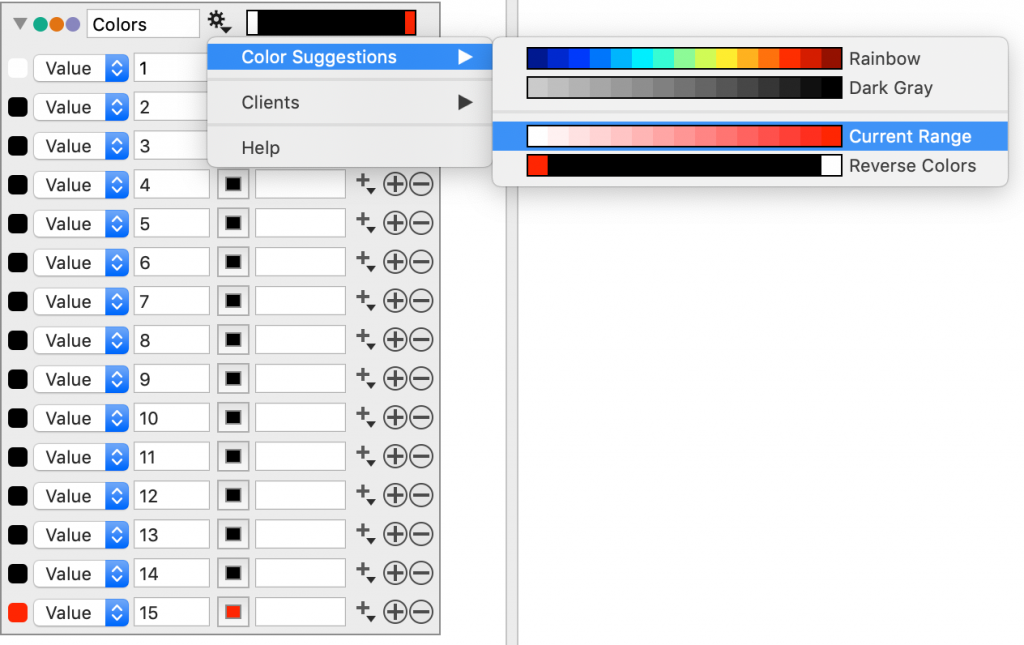
When you have 10 or more colors, the number of options are more limited.
When you exceed 12 entries, the only color suggestions given are:
- Rainbow – spectrum color ramp
- Dark Gray – a ramp from grey to black
- Current Range – a discrete color ramp from the first and last colors
- Reverse Colors – a reverse of the current colors
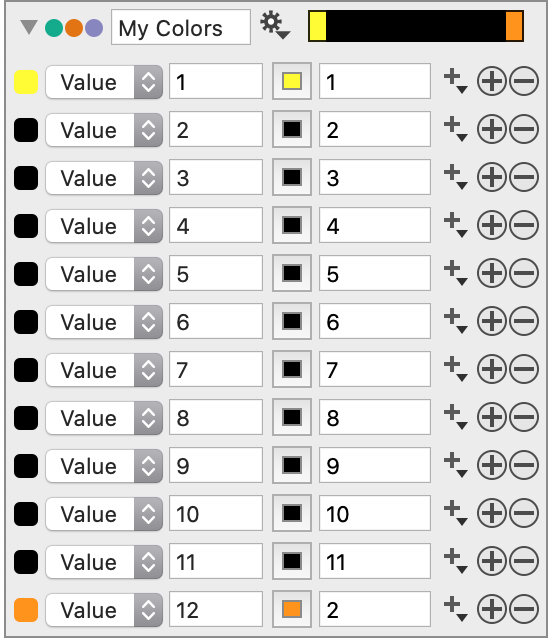
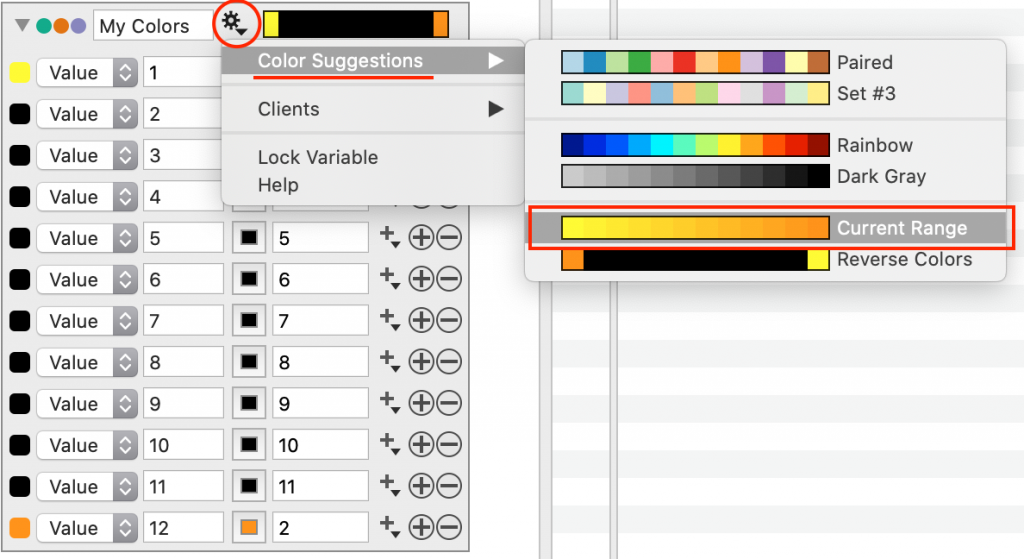
Current Range
Create a custom blend of two colors.
Step1: Specifying the first and last color.
Step 2: Click the gear menu and select Color Suggestions > Current Range.
Strides
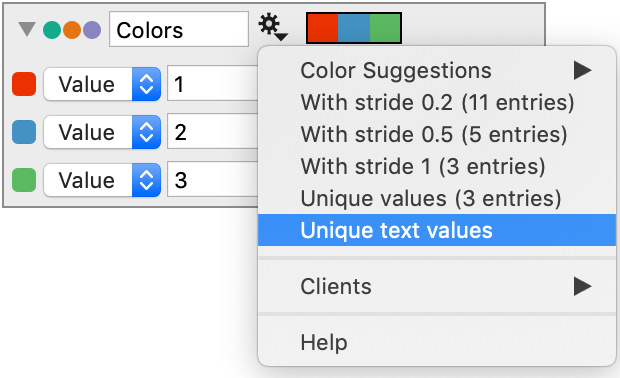
The gear menu can also be used to suggest strides or unique text values based on the current content in the graph where the color scheme is being used, as shown below.
NOTE: If the color scheme is not being used by any drawing commands you will not see these selections in the gear menu.
Legend Text
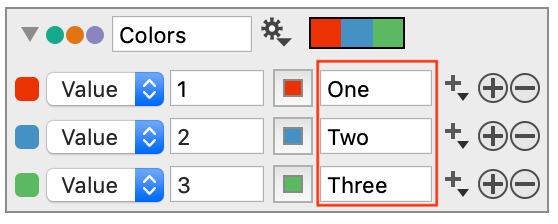
The Text box to the right of the color Tiles is where you can enter a name that will be displayed if you include the color scheme in a legend.
To display the colors in a legend you must use a Custom Legend command.