How to Calculate the Area Under a Curve
There are two ways to calculate the area under a curve in DataGraph. Either calculate the total integral using the Expression variable. Or calculate the cumulative integral in the data table using the Plot Action column.
Both methods use discrete values in the data table to estimate the integral using the Trapezoid rule (https://en.wikipedia.org/wiki/Trapezoidal_rule).
Total Integral
To illustrate calculating the integral we will use a simple data set where we know the area under the curve is equal to 0.5.
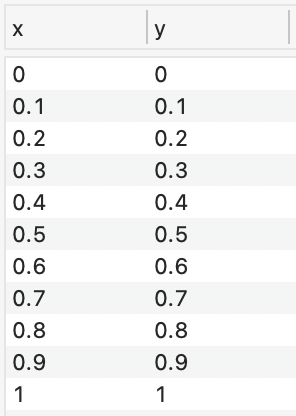
Here is a plot of the data. The computed area should match 0.5.

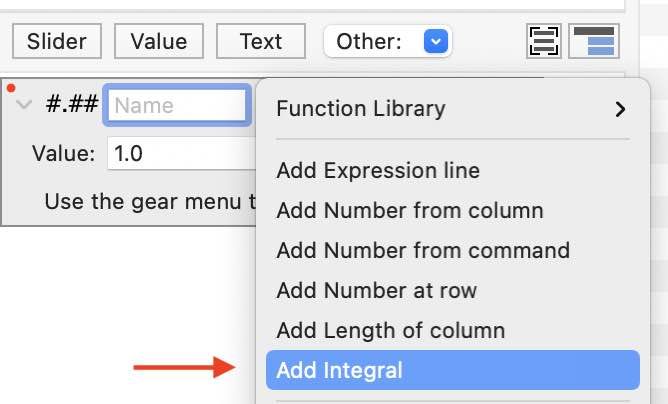
Use the Other menu to add an Expression variable. Select the gear menu on the variable object. Select ‘Add Integral’ as shown below.
Select the column for the x and y values. To output the integral, set the local variable as the Value. In this example, the local variable is called ‘a’. Thus, the Value is set equal to ‘a’.
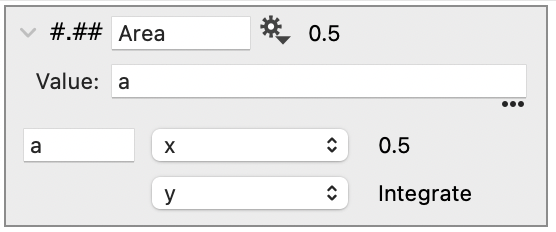
The variable can be used in a title or Text command to show the calculated value in a graph.

Cumulative Integral
This section will illustrate the same calculation as above, but as a cumulative integral.
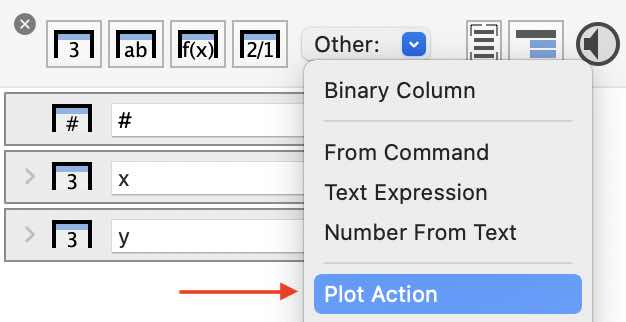
Use the Other menu above the column list, add a Plot action column. As shown below.
Select the x and y input columns. Notice that the Action = ‘Integrate’ and Method = ‘Trapezoid’ by default. You can also chose ‘Left’ or ‘Right’.
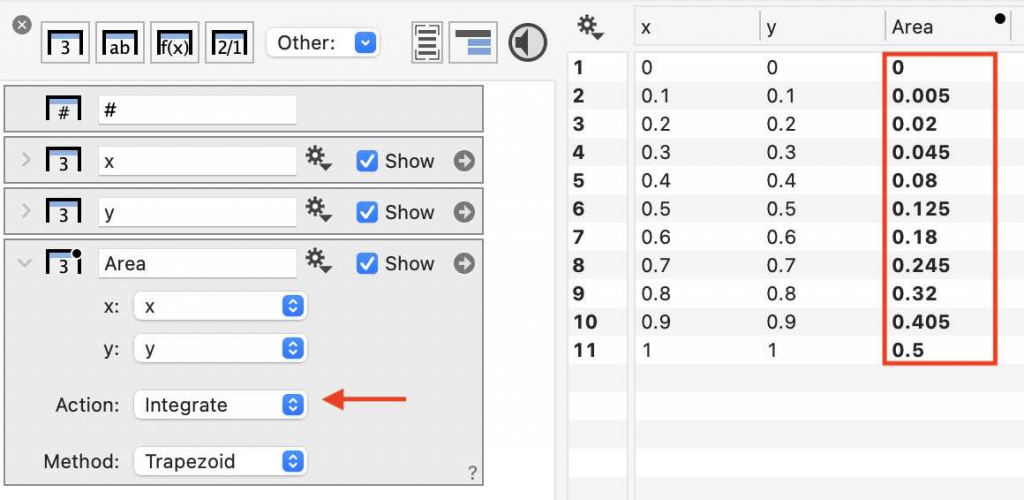
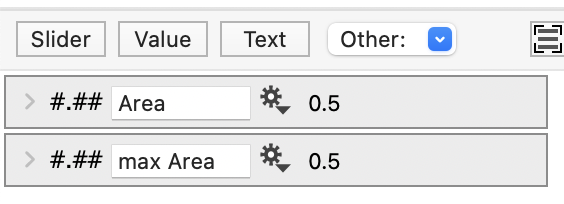
The last value in the cumulative integral equals the value in the total integral. Thus, you can use a the maximum value from this column for a variable with the total variable.
A shortcut is to click the gear menu on the Plot Action column. Select Number from column > Maximum.
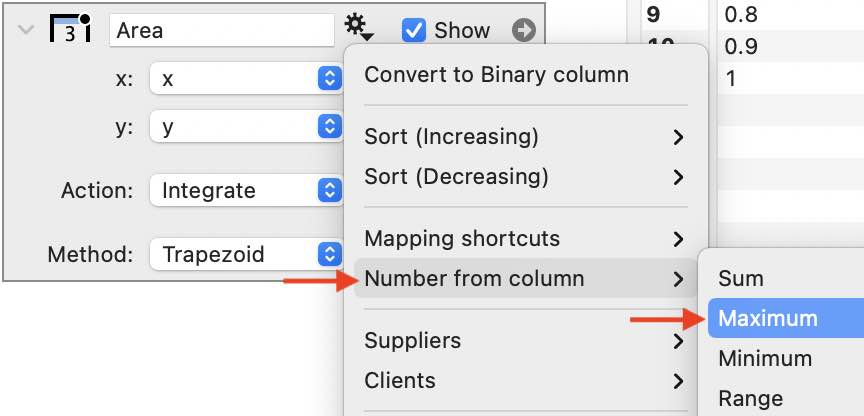
Using the Expression variable or the maximum of the Plot action column, results in the same value is output. In this case, the value is 0.5.