How to Update Data
You can update or replace data in a DataGraph file. All your graphs using these columns will update automatically as well.
To update, import new data with existing data selected. The data will be replaced during import. The process is different depending on whether you have entire columns selected or select row data.
- Select columns – Replace all the data in selected columns, including the column names.
- Select rows – Replace data in selected rows without changing column names or data types.
Select Columns
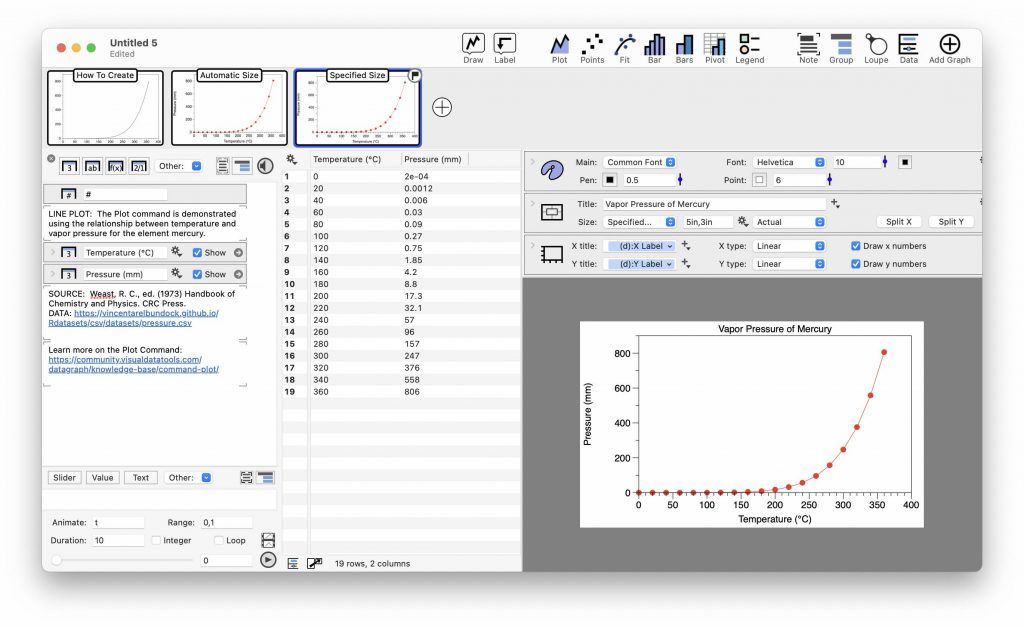
To try this out, open the example files (File > On-line examples) and open the Line Plot example file (Basic section). This file contains data on the vapor pressure of mercury.
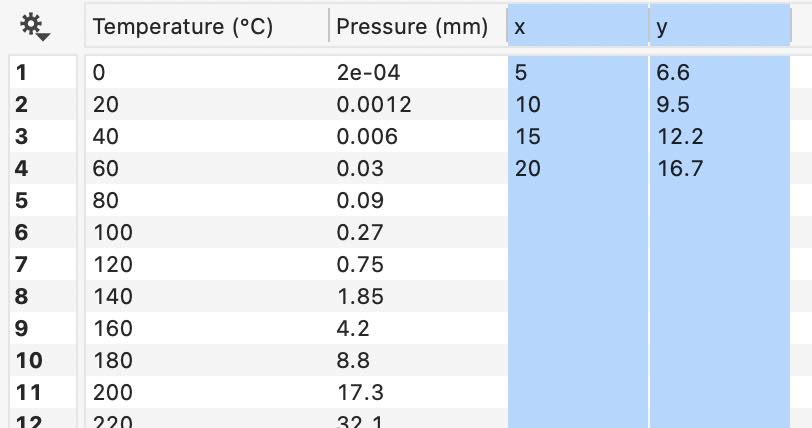
Copy the following data to the clipboard.
| x | y |
| 5 | 6.6 |
| 10 | 9.5 |
| 15 | 12.2 |
| 20 | 16.7 |
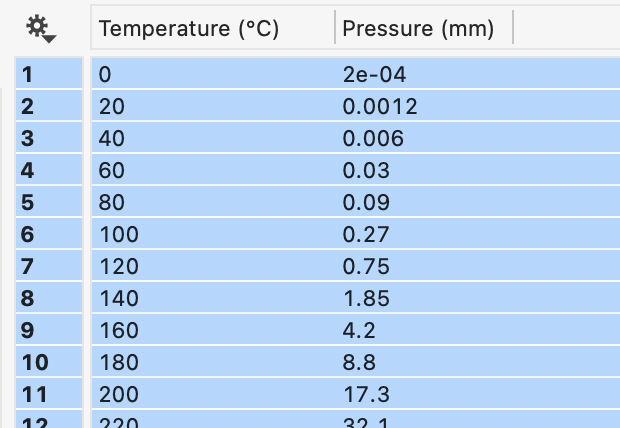
To paste over the existing data, click the header for the first column to select. Next, hold the shift key while clicking the second column. This will highlight both columns.
Then, use Edit > Paste (⌘-V). This replaces the data and the headers. It also updates the graphs that are using the data, as demonstrated in the following video.
Select Rows
Instead of selecting columns, this example shows what happens when you highlight rows.
To try this out, use the same file and copy the example data as above. Next, click anywhere in the data table to select a row. To select all the rows, you can use Edit > Select all (⌘-A).
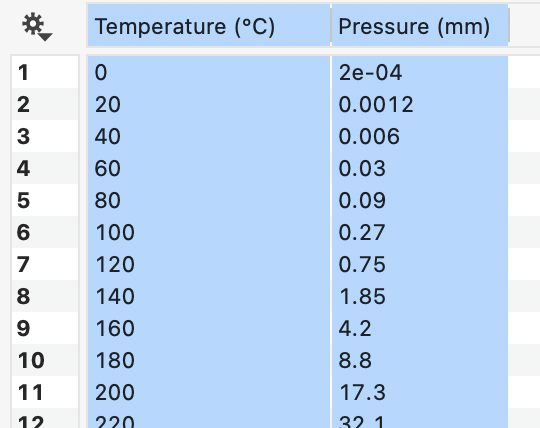
With all the rows selected, the table will look as follows. Notice how the column headers are not highlighted, compared to the example above.
When you paste in the data (Edit > Paste or ⌘-V), the program will show you a pop-up to confirm the location of each column you are pasting.
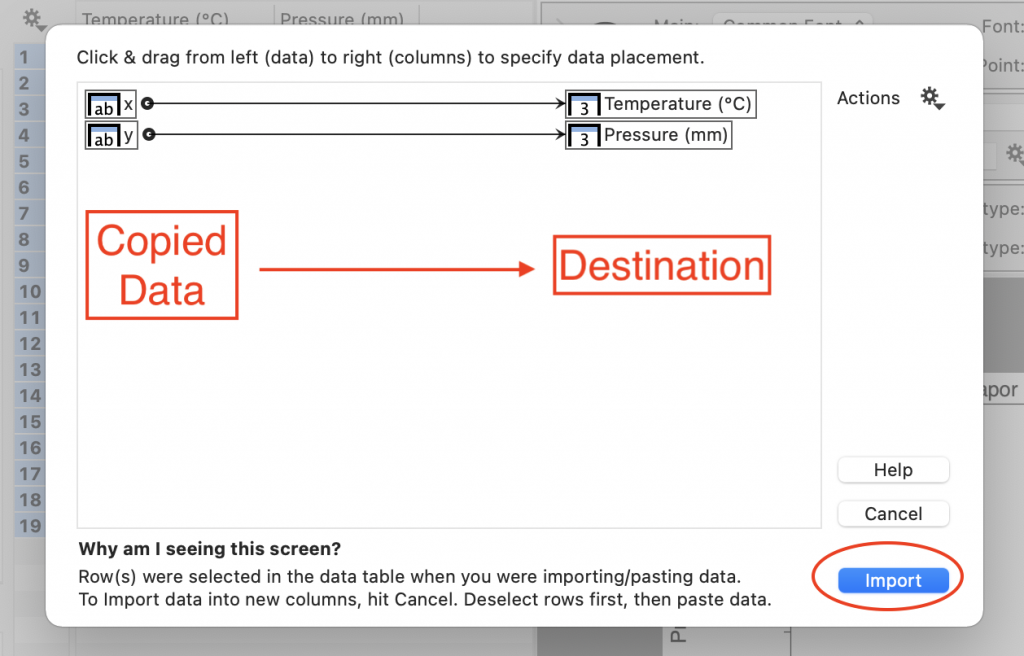
Click Import to confirm. The data is replaced but the column headers do not change.
No Data Selected
If you don’t have any data selected and you import a new file, the columns will be added to the end of the data table.