Batch Export
Use variables to batch export graphs that depend on those variables. This functionality makes it possible to output many graphs that change with a single variable.
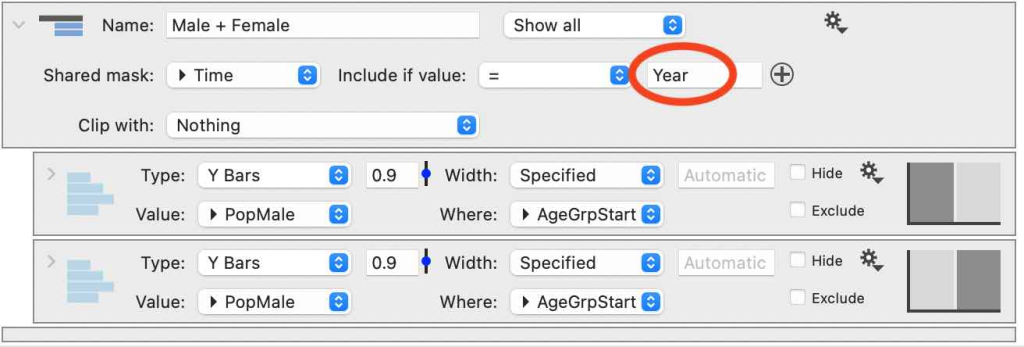
For example, use a variable as a mask to select data in a graph. Then, use the variable gear menu to output all the graphs that depend on the variable.
Text Menus
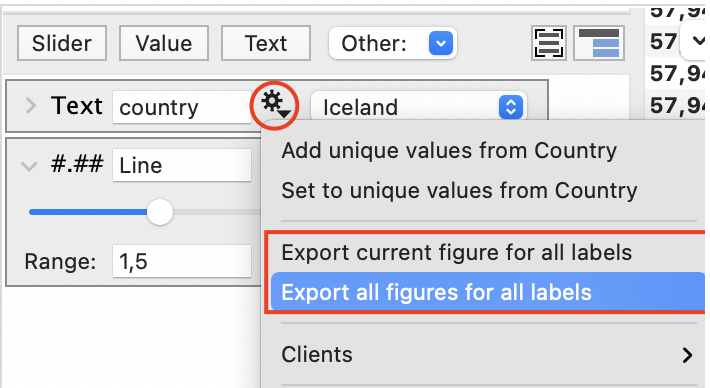
Rather than creating a graph for each menu option, use a Text menu to select data or batch export figures for all possible selections.
- Click the gear menu on the Text menu.
- Select Export current figure or Export all figures.
- Select the location to place the graphs from the finder.
The graphs will be created for all text menu entries, and the file name will contain the variable.
Slider Variables
Download our Beta version to use this feature.
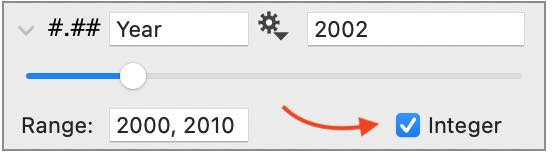
Slider variables can be used in masks to provide a discrete value for selecting data in a graph. For example, here is a variable that is set up for the year 2000 to the year 2010. Notice that the integer box has been checked.
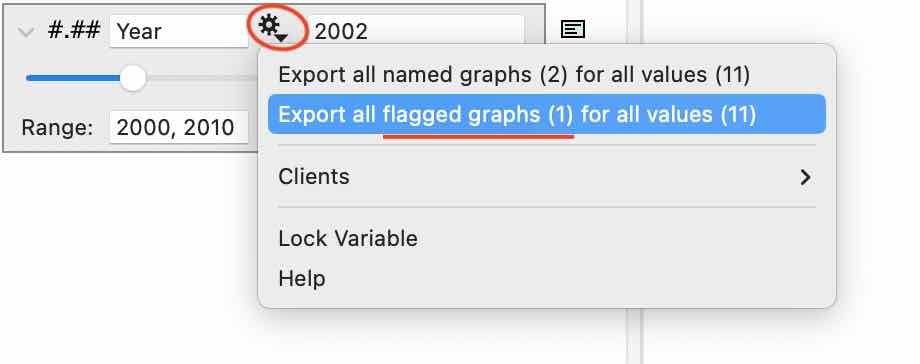
Click the gear menu on the slider variable to see options for exporting graphs that depend on the variable. You can export all the graphs dependent upon this variable or flag particular graphs (Flag on the Graph Thumbnail) to export only those.
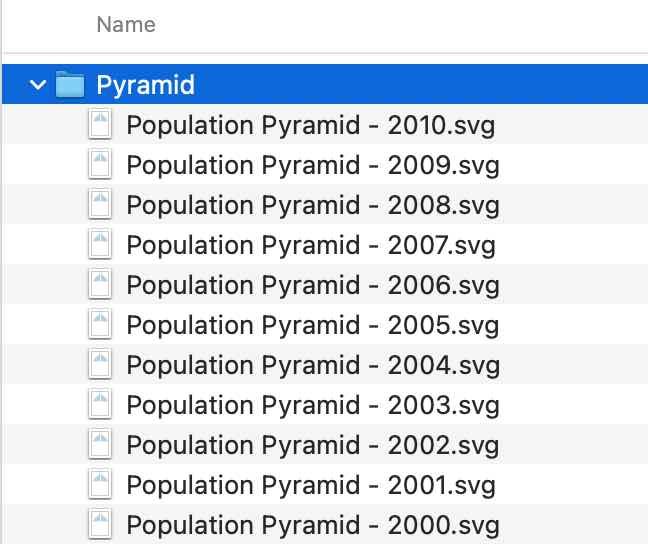
For example, here is a Population Pyramid graphic, where the data shown varies by year, depending upon the slider’s value.

After you select your option from the slider gear menu, choose a location where you would like the graphs saved and specify the graph type. DataGraph will output each graph name, followed by the integer value used for that graph.