Text Formatting
When DataGraph displays a text, from a text box, a tokenized field or a data column, it applies the formatting as defined in the Style settings, including font size, bold, italics, and color.
In addition, the program will look for commands in the text string that alter the format, draw symbols, or display mathematical operators. The form of these commands comes from the TeX typesetting program. DataGraph implements a sub-set of these commands, and adds a few commands of it’s own.
The examples below show how to type the text commands, several of which also take input arguments. Arguments can be single character, or blocks enclosed by curly braces – {}. Curly braces have special meaning to limit the scope and define arguments. If you want to insert a curly brace, use the commands \{ and \}.
NOTE: For a good reference book, download the “IShort – A Short Introduction to LaTeX2e” from CTAN. This contains a reference of the entire system, but the section that is particularly relevant describes typesetting mathematical equations.
Bold and Italic
Apply a bold or italicized setting to a single word or a group of words.
Single word {\it italic}, and {\bf bold and {\it italic}}, and the rest is \it italic.

This is a slightly non-standard way to handle font styles, but works better across font families, and as explained below, a lot of additional flexibility comes by using this method. These commands switch the mode, and take no argument. If you have an italic/bold font and want to make it plain use the \rm switch.
Color
To change the color, you can use one of the color switches \red, \green, \blue, \black, \white.
Text that is {\red red} or {\blue blue {\green green} and} black again.

You can also use \rgb to specify the red, green and blue components from 0 to 255, as a fraction of 0 to 1, or using hex codes to enter colors.
I love the colors {\rgb{0,.5,.5}forest green} and \rgb{FA8072}salmon.

Underline, Overline & Strikeout
To underline something, instead of a switch, you use a command structure. This i done with the \underline or \uline command, which do the same.
Words can be \uline{underlined}, \uuline{double underlined}, \sout{stricken out}, \overline{overlined}.

Note that \uline and \underline do the same, and \strikethrough and \sout are the same.
Super and subscript
To super-script or sub-script one or more characters, you use the _ and ^ keywords. Again, if you want show the symbols as characters, use \_ and \^.
Use single^a or multiple^{superscript}, both^{super}_{sub} scripts.

Braces
The Bracket command can add curly braces to a graph, but if you want to include an overprice or underbrace in text, use these text strings.
\overbrace{over this}^{put above} and \underbrace{under this}_{below}

Symbols
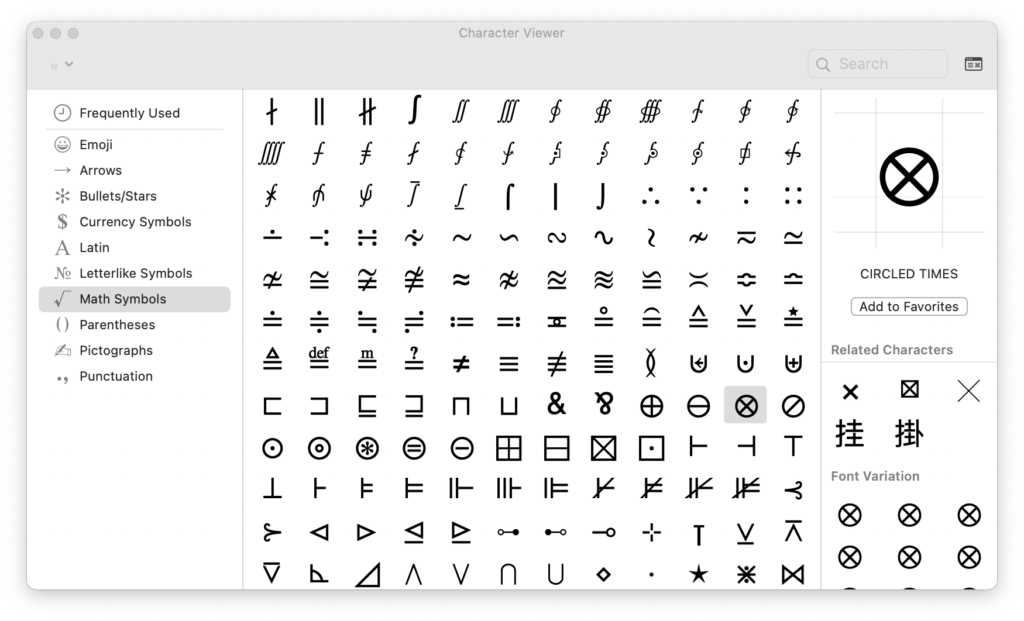
You can enter any unicode symbols directly into any text string. Copy and past the unicode characters or enter using access the Character Viewer.
To use the Character Viewer:
- Select Edit > Emoji & Symbols (or ^⌘-Space).
- In DataGraph, place your cursor in a text or number entry box.
- In the Character Viewer, double click the symbol to add.
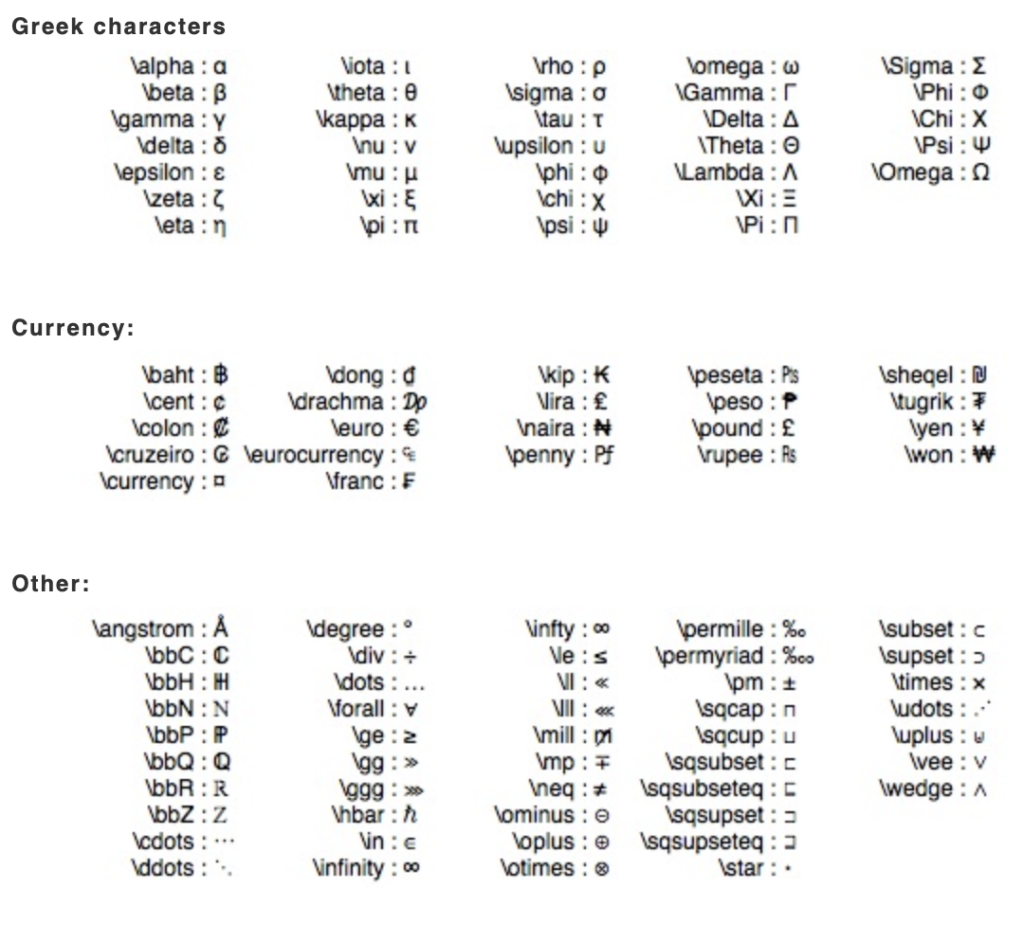
Alternatively, you can enter many characters using LaTex commands.
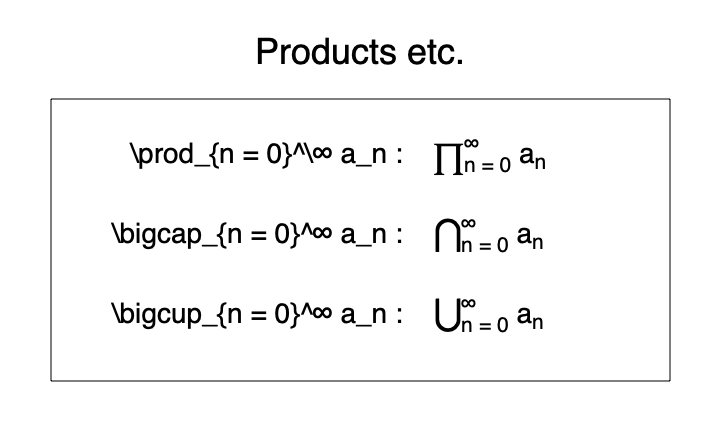
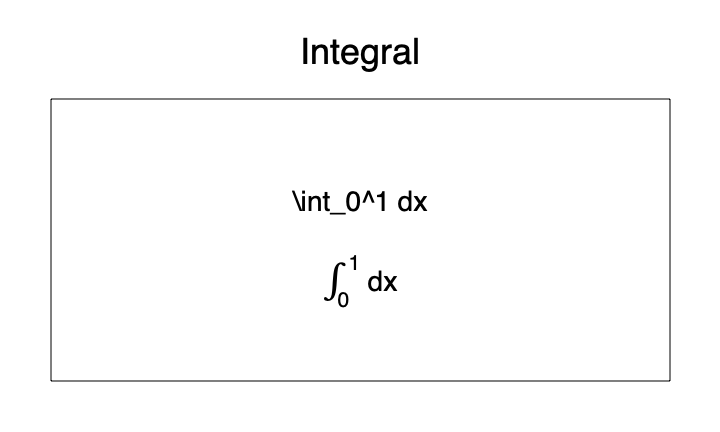
Operators
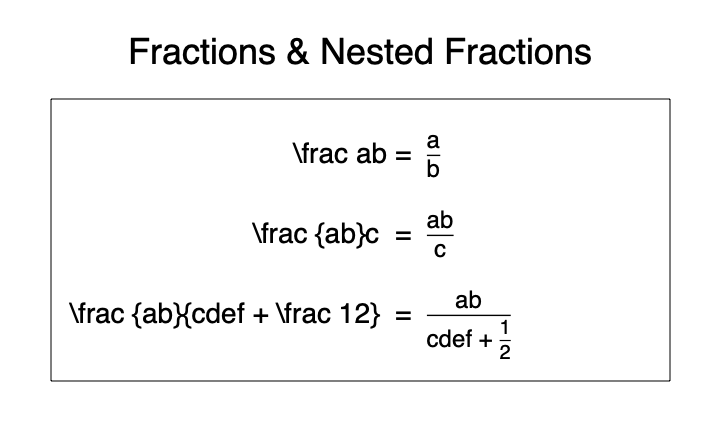
The fraction operator has two arguments.
There are two forms for square roots \sqrt{} and \sqrt[]{}, where the second one can take an argument.
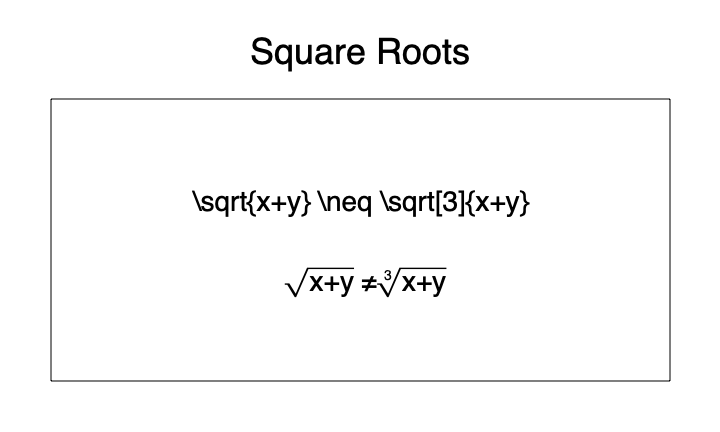
Note that there are two spaces after \neq. This is because the first space gets treated as a delimiter to end the \neq command. The second space is then the space after the not-equal sign.