DataGraph
-
Getting Started
-
User Interface
-
Data
-
Columns
-
Variables
-
Commands
-
Layout settings
-
Customize
-
Functions
-
Exporting
-
Scripting
-
Beta
-
Versions
-
Join the Community
Print
One Sample t-Test
Updated
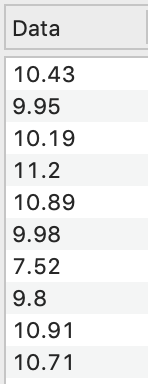
Data: 10.43, 9.95, 10.19, 11.2, 10.89, 9.98, 7.52, 9.8, 10.91, 10.71
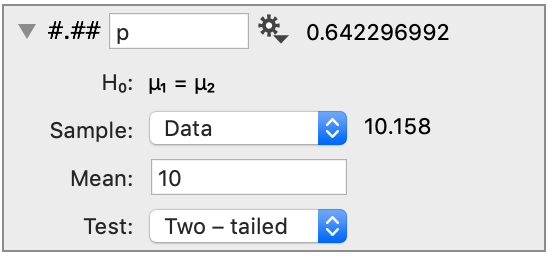
Input
Sample
Select a single column of data.
Once selected, the mean is calculated and shown the right of the menu.
Mean
Enter a number or a variable. The sample data is compared to this value.
Test
Choose between a two-tailed test and a one-tailed (one-sided) test.
Output
The output is the p-value.
On This Page