Histogram
The Histogram command provides a visual representation of a distribution of numbers. A histogram will count the number of values in a particular range or bin. The command can also be used to determine other summary statistics for a list of numbers.
Input
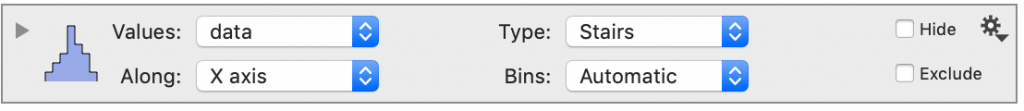
The Histogram command requires a single column of numbers or dates that are specified in the Values drop-down box.
Options
Type
The Type menu allows you to select how to draw the histogram
- Centers
- Stairs (default)
- Bars
- Spaced bars
- Left/Below
- Right/Above
- Smooth
The default option is ‘Stairs’, which does not draw individual bars but instead just the tops, and approximates the probability density function. ‘Stairs’ is useful when you have a large number of bins, and is the default setting for this reason.
‘Left/Right’ will allow you to compare two distributions, one command will draw the histogram on the left side of each bin, the other on the right side of each bin.
The ‘Smooth’ option adds together Gaussians. You can adjust the width of the Gaussians using a slider or by specifying the value exactly.
Along
Use the Along drop-down box to draw the histogram along the x-axis or y-axis.
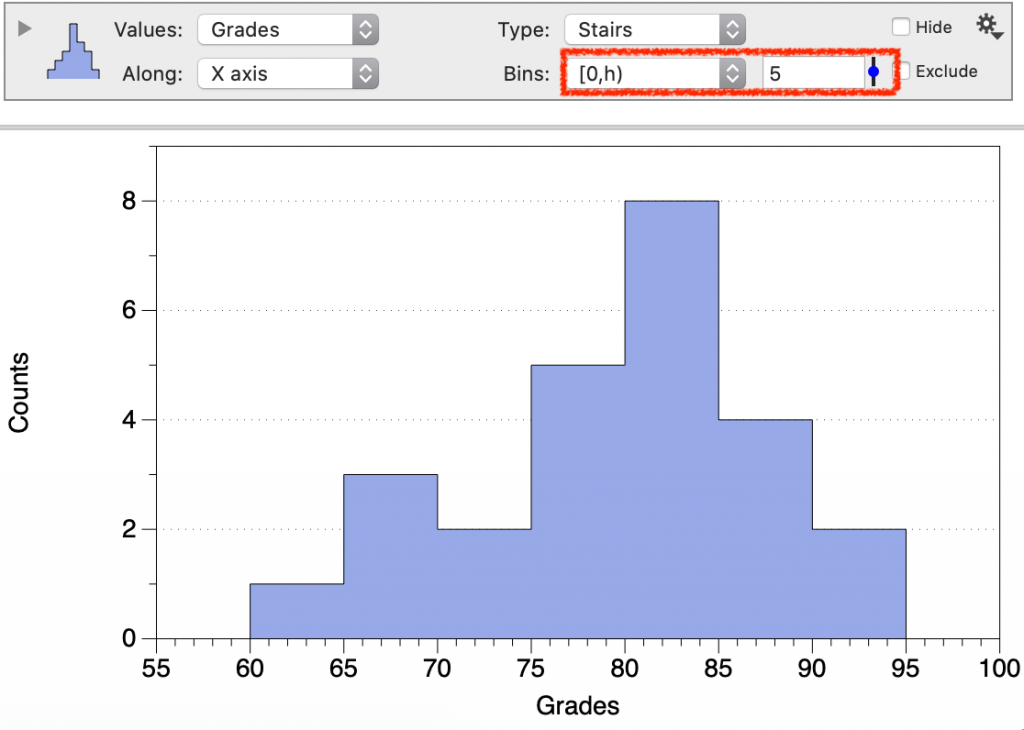
Bins
The bins can be set to:
- Automatic – tries to pick a reasonable number of bins (default)
- [-h/2, h/2) – left-side is included, right-side is not
- [0, h)
- Log bins [1,h)
- Date
When you switch from Automatic, you can specify the bin width, h, by:
- entering the value
- using a slider
- setting to a variable
If you chose to bin according to dates, you can choose several built-in date options (year, quarters, month, week, etc).
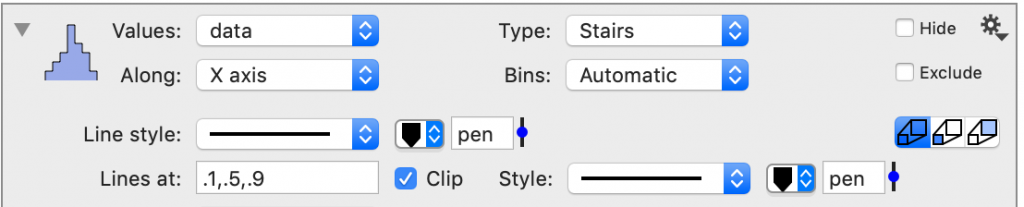
Line style
You can change the style of line, color, and width.
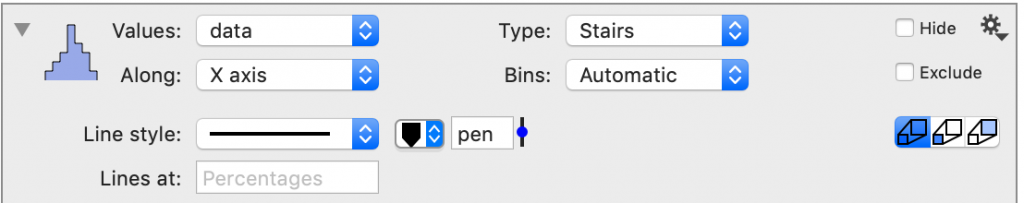
You can also specify percentages to draw lines. You can type the percentage as a fraction or using the percent symbol (e.g., 0.1 or 10%). When a percentage is drawn, a menu for the style of those lines is shown.
Fill
You can vary the fill of the histogram.
Weights
By default the weight is 1, meaning that the value for a bin is the sum of the values for that bin. You can select a column to apply a weighting factor.
Units
The Units menu can change how the distribution is represented.
- Count – that the y values are how many numbers are in each bin
- Density – the y-value is count/bin width
- Probability – count/(width*total count)
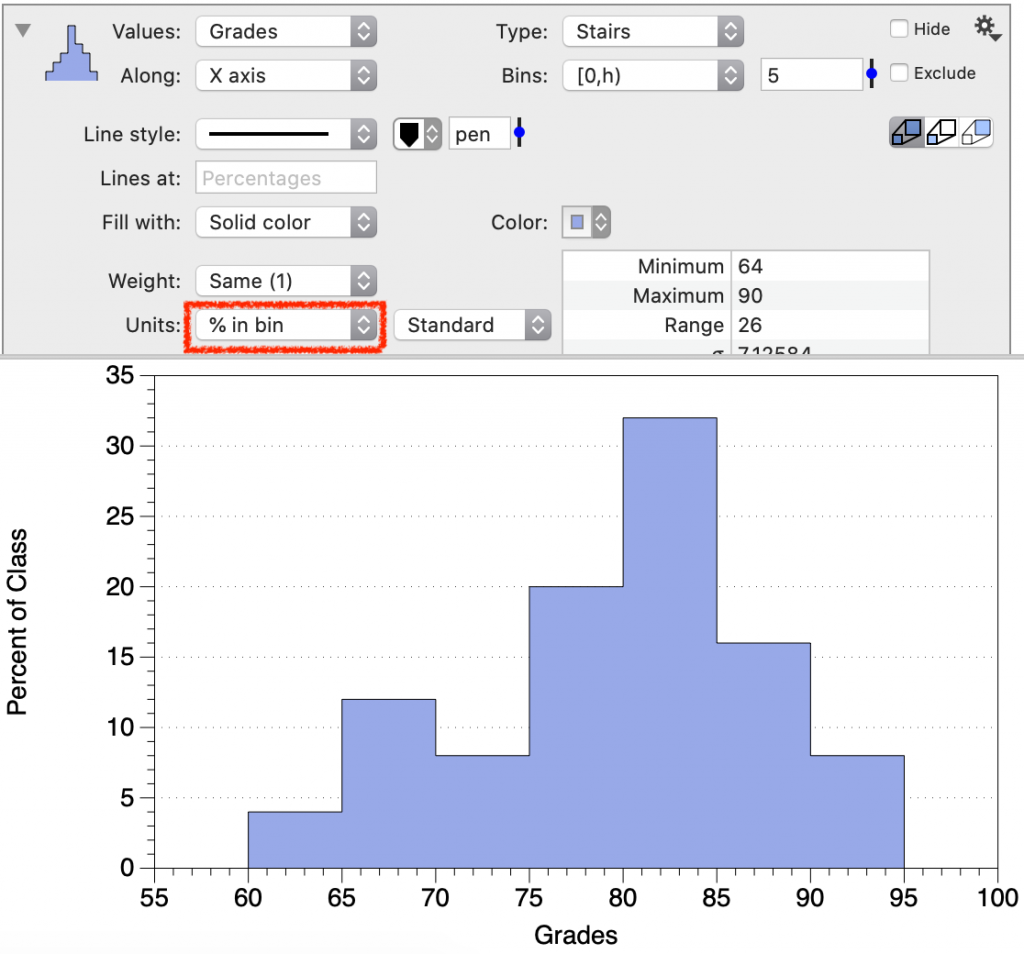
- % in bin
Consider the integral of the curve. For ‘Density’, the total integral is the number of values. For ‘Probability’, the total integral (area) is one.
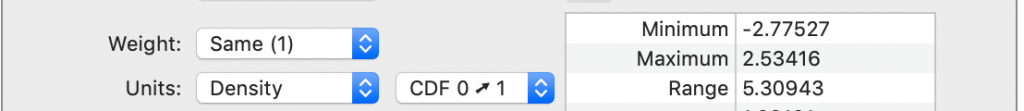
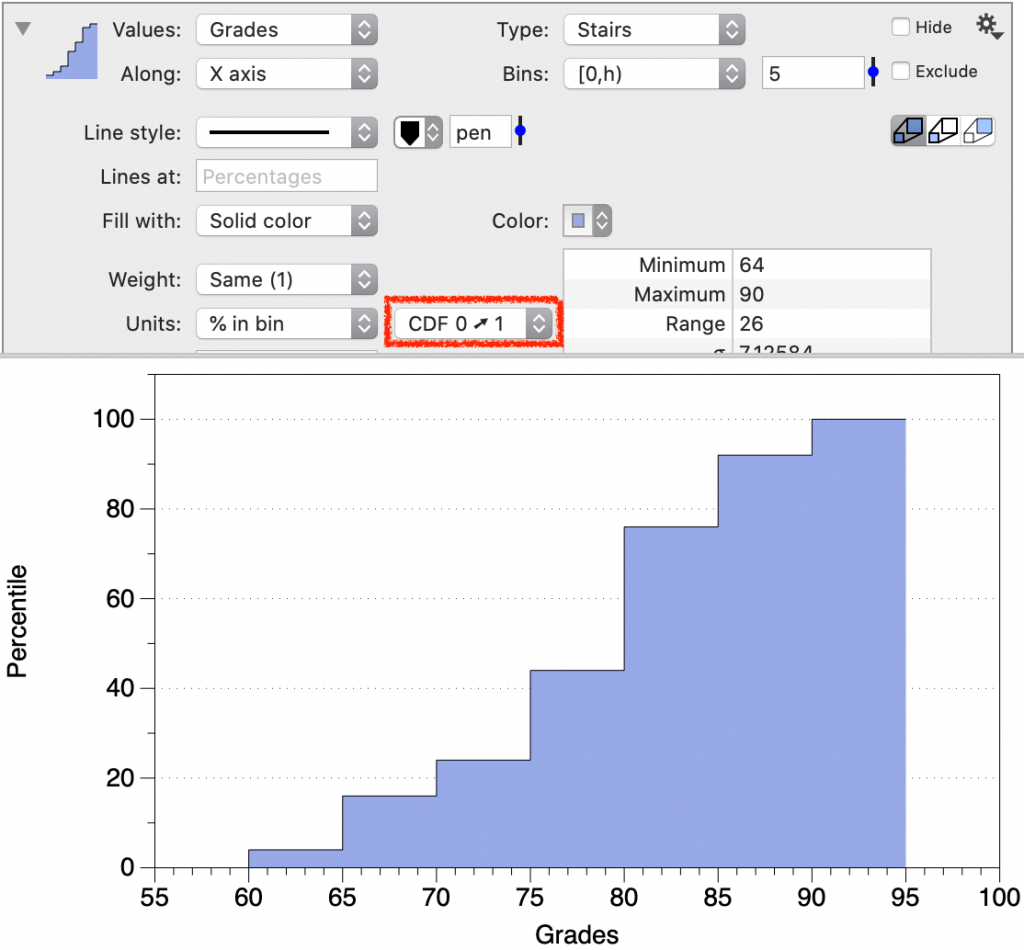
To the right of the units, you can choose to plot the data as a cumulative distribution function (CDF).
Percentile
The units on the y-axis can be changed to the percent in a bin.
Cumulative
The plot can also be displayed in the form of a cumulative percent, or cumulative distribution function (CDF).
Output
Use the Histogram command to extract summary statistics.
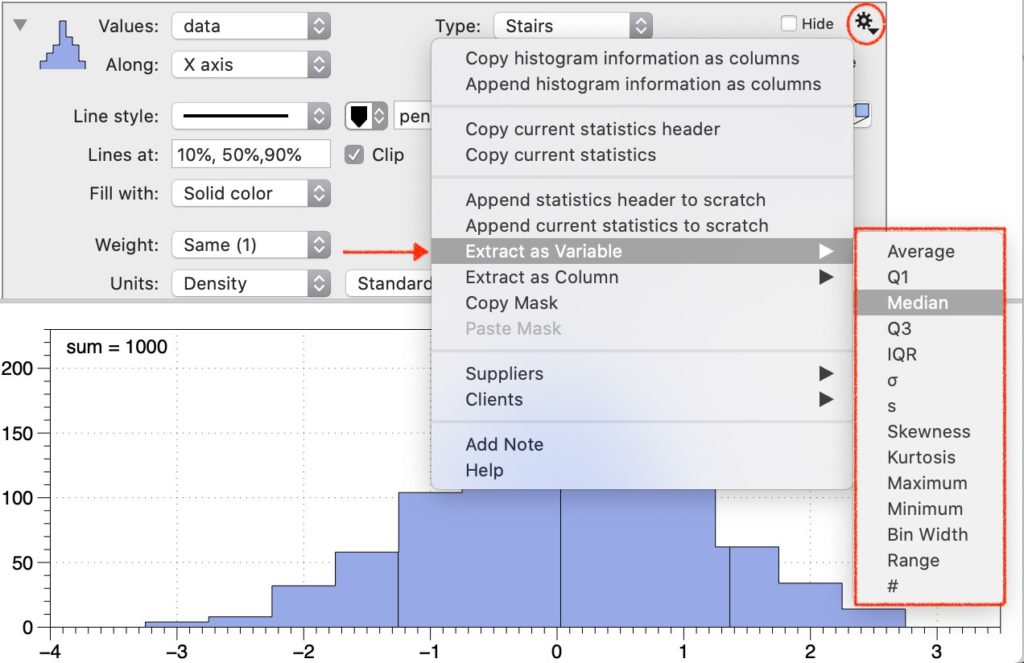
Variables
Extract individual statistical parameters by clicking the gear menu and selecting extract as variable. The value will be extracted into a Number from Command variable.
Columns
Extract columns that contain the bin locations and bin values using the gear menu. This creates a From command column.
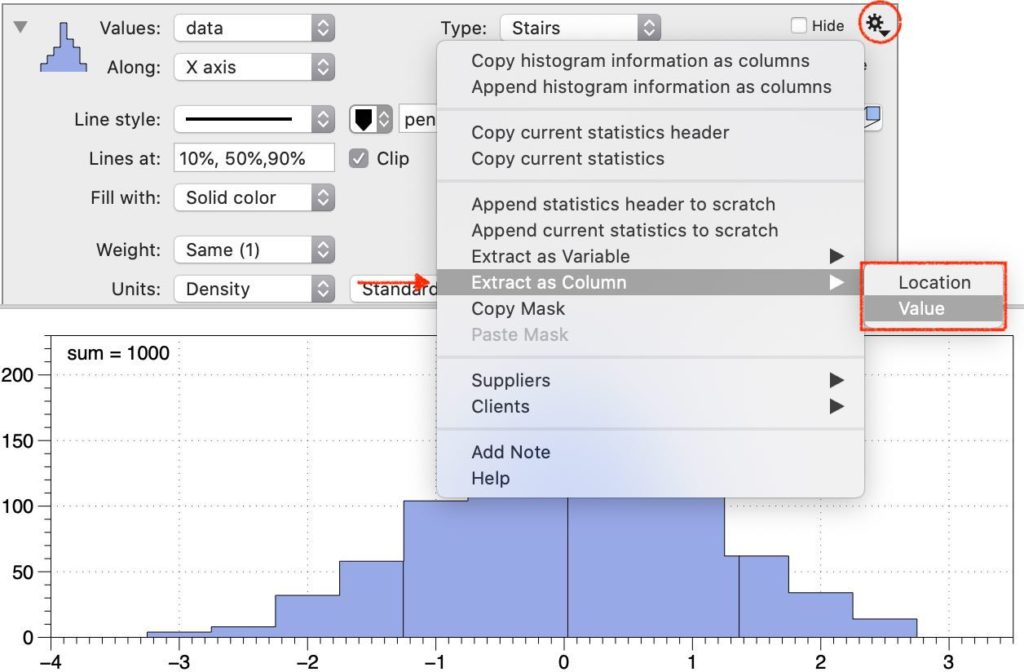
To extract both columns at once, select Append histogram information as columns.