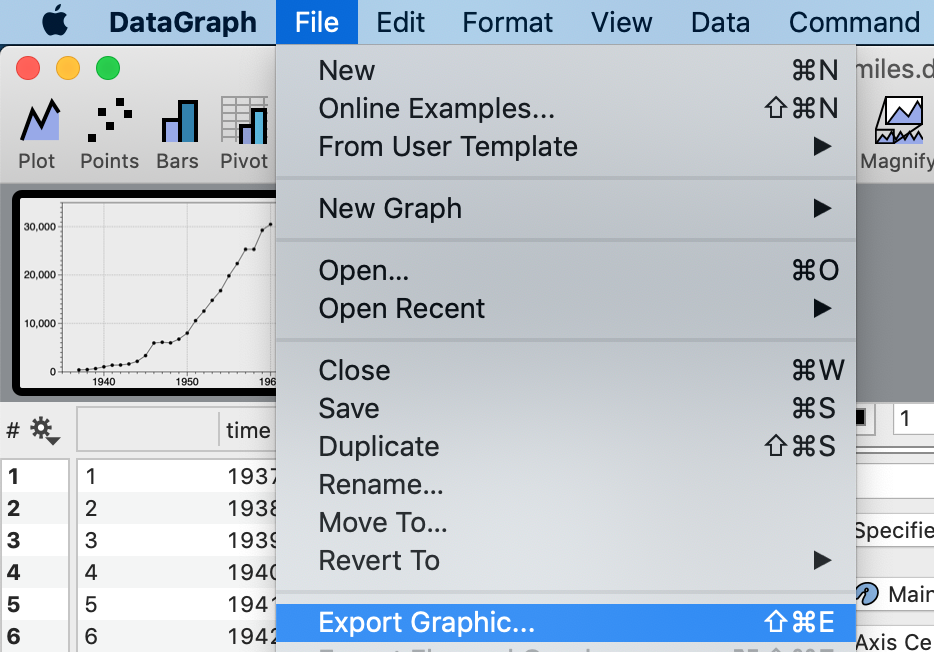
How to export an image from DataGraph
In the File, menu select Export
You will be promoted for the file name and file format. The format you chose depends on how you plan to use your images.
DataGraph supports both vector graphics and bitmap images.
NOTE: If you want to embed an image in another document you can do so directly without exporting a separate file.
Vector Graphics
Vector graphics can be resized without any loss in image quality.
In general, most journals prefer vector graphics, as explained here for Science magazine.
| Portable Document Format | |
| EPS | Encapsulated PostScript |
| EPS (Word) | Encapsulated PostScript (includes a low resolution bitmap Word uses as a preview) |
| SVG | Scalable Vector Graphics for web publishing |
| DTG | DataGraph Image File (transfer between DataGraph files) |
NOTE: DTG is a special vector format used by tools made by Visual Data Tools. This format allows you to save a graphic to include back into a DataGraph file. The benefit is that everything that is drawn on screen is saved into that file.
Transparency
When you create an image with a transparency, PDF images will have the option of excluding the transparency in the output. This option is included as some postscript printers may have problems rendering transparencies.
NOTE: The EPS format does not allow for transparencies. When you chose EPS and have a transparency in your image, DataGraph will convert the transparent colors to opaque colors, assuming a white background.
Bitmap Images
Bitmaps or Raster formats contain a grid of pixels, as a result, the image quality can degrade when the image is resized.
| PNG | Portable Network Graphics |
| PNG with α | Portable Network Graphics with alpha channel (transparent) |
| TIFF | Tagged Image File Format |
| TIFF with α | Tagged Image File Format with alpha channel (transparent) |
| JPG | JPEG compressed format |
PNG and TIFF are compressed formats that are lossless, meaning that the picture is saved exactly as you view on the screen. JPG uses a lossy type of compression, which can reduce file size but may cause noticeable image artifacts.
For graphs that do not have gradients, PNG is most often the best option. JPG may be better for images with gradients or for graphs that include other images, in terms of minimizing file size.
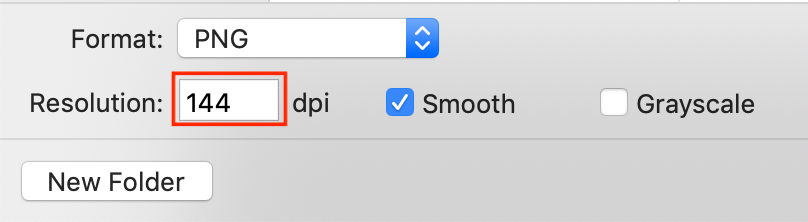
Resolution
When you choose a bitmap format, you can specify a resolution, the dots per inch or DPI output.
The resolution you chose depends on how you are using your image. For example, for web publishing or on-screen viewing, 72 or 144 dpi is sufficient. For a publication that will be printed, 300 dpi or more is needed (OR use a vector format such as PDF).
Here are some examples to help you chose:
- 72 — Standard screen
- 144 — Retina quality screen
- 300 — Standard printer
- 600 — Desk Jet & Laser printers
- 1200 — Fine print setting
- 2400 — Photo quality printing
Smooth
The smoothing option is a standard technique that applies anti-aliasing to create smooth looking lines and edges at low resolutions.
For higher resolution images (e.g., 600 dpi), you can typically turn off the smoothing without sacrificing image quality.
In rare cases where you have sharp lines, smoothing may cause adjacent colors to blend incorrectly. In such cases, you may need to remove smoothing and can increase the resolution to get a sharp image. Less blending also creates less colors, and can be better for compression.
Greyscale
Creates a greyscale image from the color image.