DataGraph
Column Properties
Column properties are a handy way to build mathematical expressions using a range of numbers, specifically a column of values.
To refer to them, type the name of the column followed by a ‘.’ and the property name.
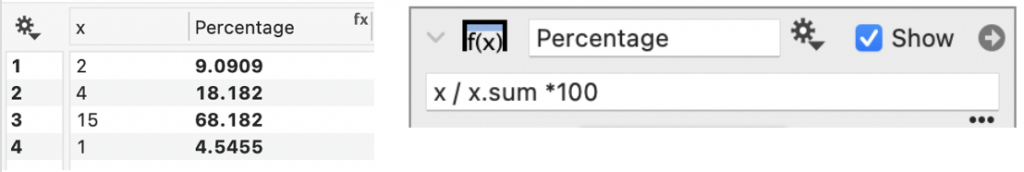
For example, ‘name.sum’ returns a single value, the sum of a column. In the table below, the column Percentage is calculated using the expression: x / x.sum * 100 .
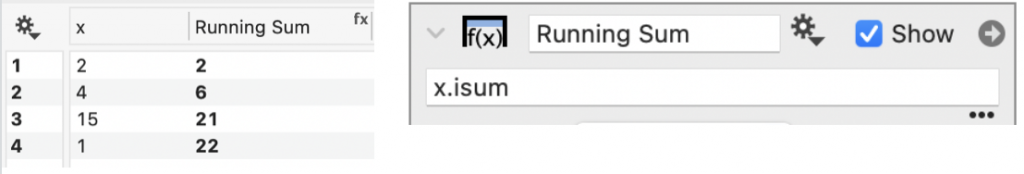
Other column properties return a column of values. For example. ‘name.isum’ returns the running sum of a column. Enter the column property alone as a expression column (as in the column Running Sum below) or in more complicated expressions/calculations.
Single values
Properties that return a single value.
| Name | Description |
| min | Minimum of the column |
| max | Maximum of a column |
| length | Number of the last non-empty row |
| range | Maximum minus the minimum |
| average | Mean of the column |
| median | Median of the column |
| sigma | Population standard deviation (σ) |
| s | Sample standard deviation (unbiased estimate of sigma) |
| sem | Standard error of the mean |
| first | Value of the first non-empty row |
| last | Value of the last non-empty row |
| sum | Sum of all finite values |
Multiple values
Properties that return a column of values.
| Name | Description |
| isum | Incremental sum, e.g., row 4 is the sum of rows 1,2,3 and 4. Restarts where there is a gap. |
| rmax | Maximum so far. |
| rmin | Minimum so far. |
| count | How many times this row value has appeared up to the current row. For example, if you have row values 3.1,1.1,2.1,1.1,1.1,2.1 the count has the row values 1,1,1,2,3,2. If you draw (x,x.count) with a Points command, you will see a shape of a histogram using points. |
| totalcount | How many times this value shows up in a column. If you have the list 3.1,1.1,2.1,1.1,1.1,2.1 the totalcount variable is 1,3,2,3,3,2 |
| sortedindex | Where this entry will be in a sorted list. 3.1,1.1,2.1,1.1,1.1,2.1 the property is the list 6,1,4,2,3,5. |
| rank | Where this entry is in a ranked list. Repeated values have the same rank. If you have the list 3.1,1.1,2.1,1.1,1.1,2.1, the rank is 1,5,2,4,4,2. This is because 3.1 is the highest value (top rank), 2.1 shows up twice so both have rank 2, and not 2 and 3. |
| sortwith | Sort a column by doing x(x.sortwith), or reorder a column using y(x.sortwith). |
| delta | The difference between two adjacent rows. The first row is empty. |
| unwrap2π | For angles, for example, computed with the angle(x,y) function the value is mapped onto a whole period such as [-π,π]. The issue with that is that when you wrap around the circle the value jumps by 2π. This column will make sure that the gap between adjacent rows is less than π in absolute value. That means that if your row entries for x are π/2,π,-π/2,0,π/2 the output for x.unwrap2π is π/2,π,3π/2,2π,5π/2. |
| unwrap1 | Similar to the last command, except the period is 1. So 0,0.5,0,0.5,0 maps to 0,0.5,1,1.5,2. |
| unwrap360 | Same except the period is 360. |