Legend
The Legend command automatically creates a legend based on the data being drawn.
Add a Legend command from the menu Command/Add Legend or select the legend shortcut from the toolbar.
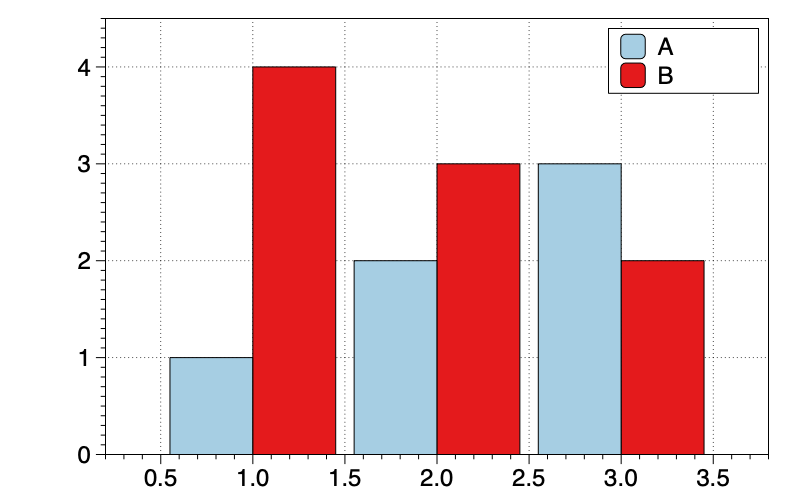
The legend is a key consisting of a label and a small graphic element that changes depending on the type of command it represents. This is the standard way to give a visual key to label lines, fills, etc.
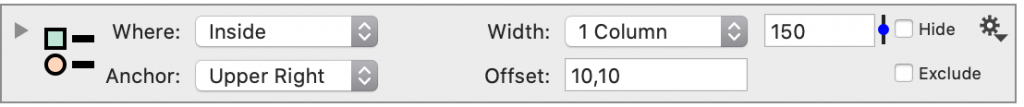
You can adjust the drawing style, how many rows to use, and where to position the legend. You can for example put the legend above the graph or to the right. If you have a second legend it will draw exactly the same entries unless you use the From axis menu
From Axis
The Legend is just like other drawing commands, when you have a split menu, you select which x and y sub-axis it belongs to.
Uses the From Axis menu to specify to only draw the legend entries from a specific axis.
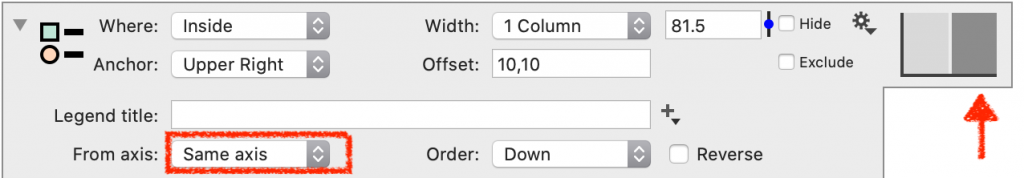
It only uses the legend strings from the drawing commands that belong to the same axis. This way for example you can have a split x-axis and two legends, one for the lines on the left, and another for the lines on the right.
Legend Name
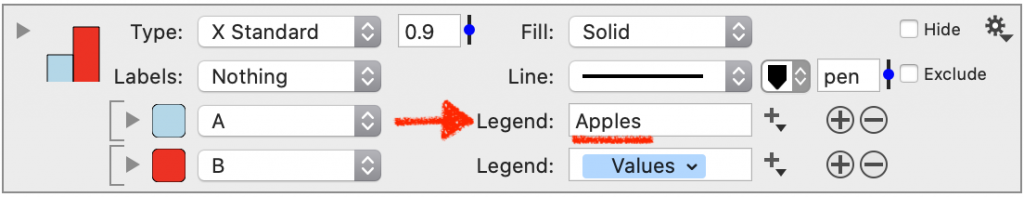
The Legend name is specified in the drawing command, typically at the bottom. By default, these names use tokens that are connected to the column names.
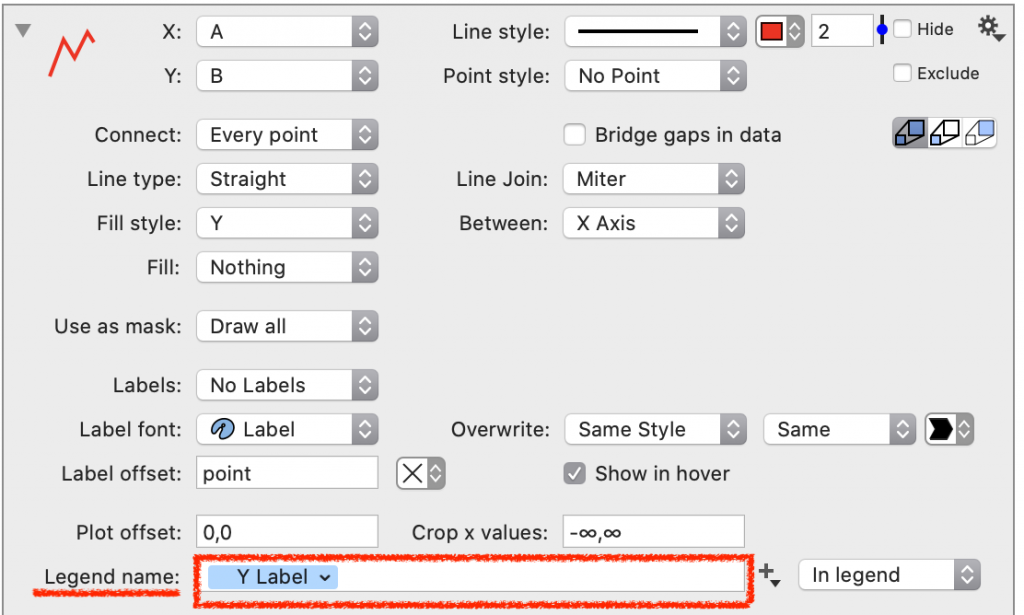
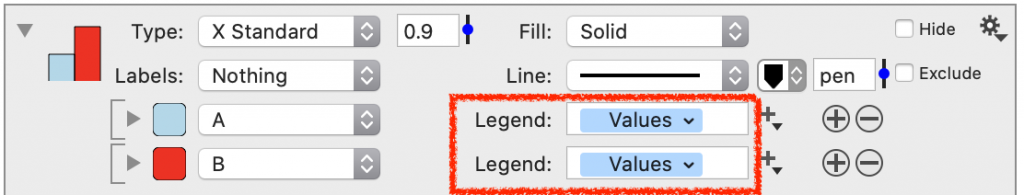
For the Bars and the Plots command, the legend is specified for each entry.
This name could be specified exactly or depend on the column name or result of fit functions, etc.
Edit on the Graph
You can also edit the name directly by double-clicking on the legend entry.
You can delete the tokens to type in the legend entry.
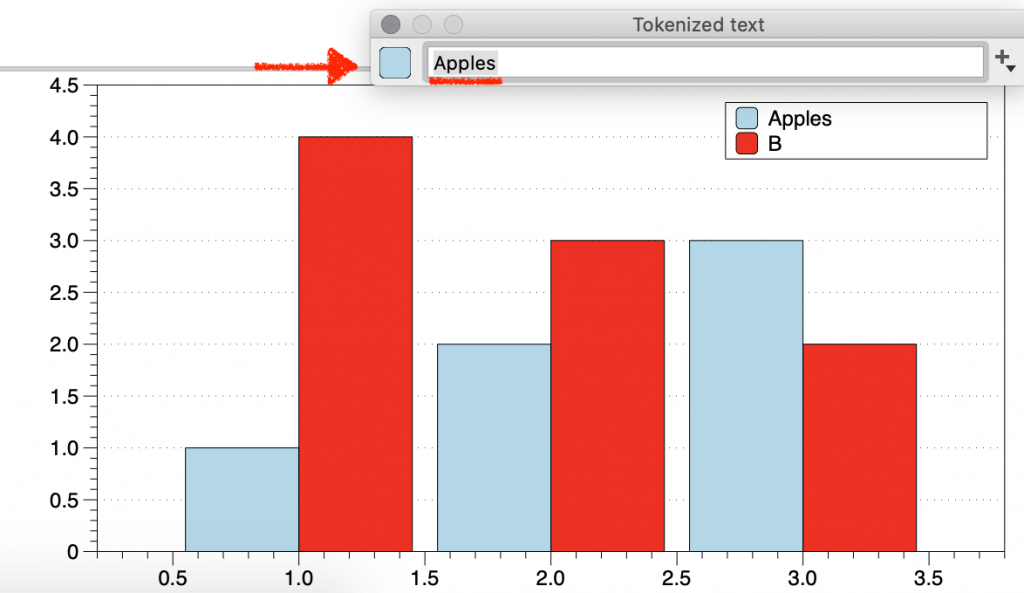
Your edit will also be saved in the command.