Split X-Axis
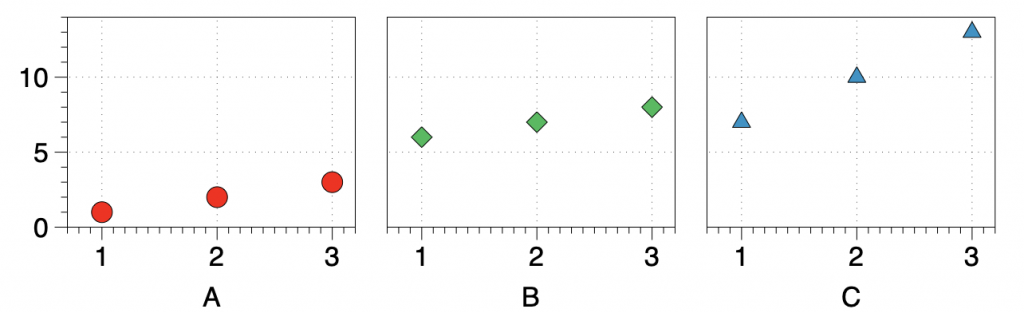
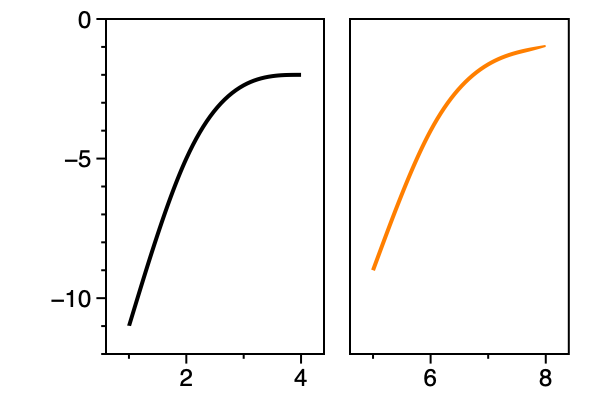
The Split x-axis option is used to create graphs where the x-axis varies, but the y-axis is shared. This is sometimes referred to as panel graph.
This option can also be used to join data on the same graph that spans a different range, or a graph with a second axis.
Add a Split
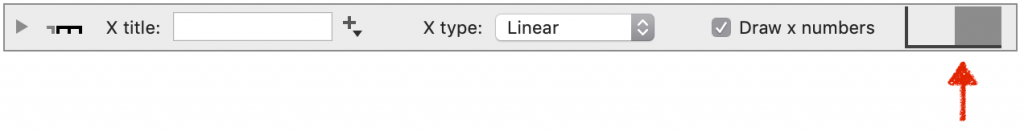
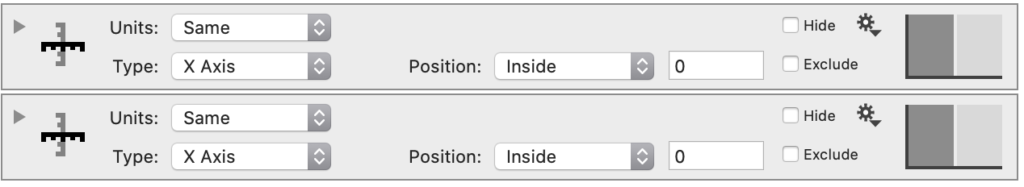
Create a split x-axis by clicking the Split X-Axis button on the Canvas Settings.

This creates an additional axis object directly below the Axis settings.
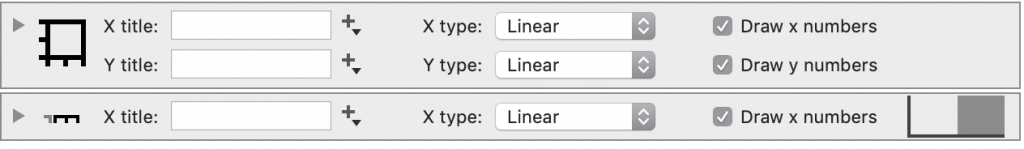
On the right side of the axis object, is a graphic that indicating which axis the object controls. In this case, the split-axis is the right side.
Axis selectors
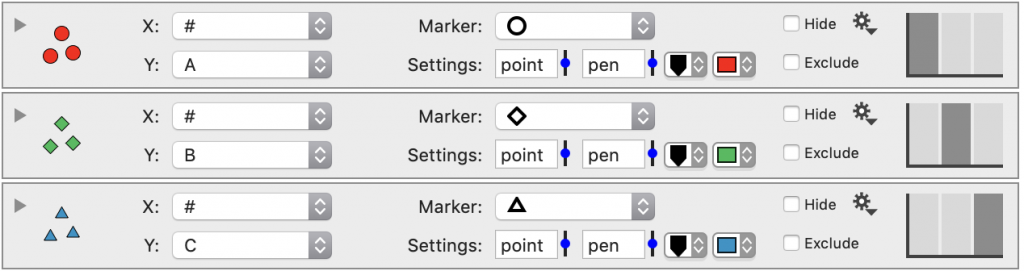
When the axis has been split, axis selector boxes will appear on the right-side of each drawing the command. The axis selector is an interactive, visual representation of the multiple-axes.
Click a ‘box’ on the axis selector to draw the command on a different axis.

For example, here the x-axis has been split twice.
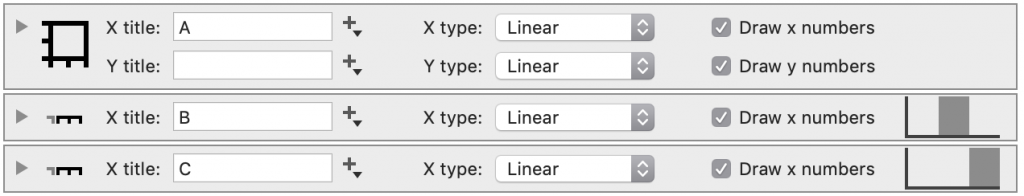
This creates a three axes or panels. Here one command is drawn on each axis.
To delete one of axes, click the axis object and hit the delete key. Commands drawn on the deleted axis are be moved to the next axis over.
Stack vs. Join
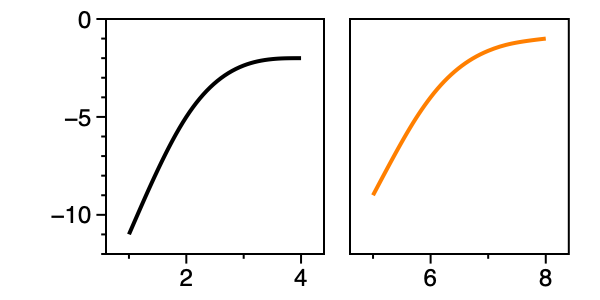
A graph with a split axis can be ‘stacked’ or ‘joined’. By default, the graphs will be stacked in separate panel-type graphs.

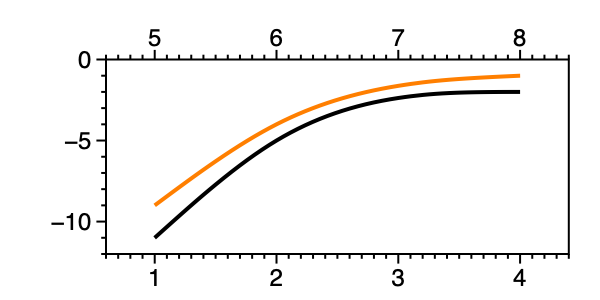
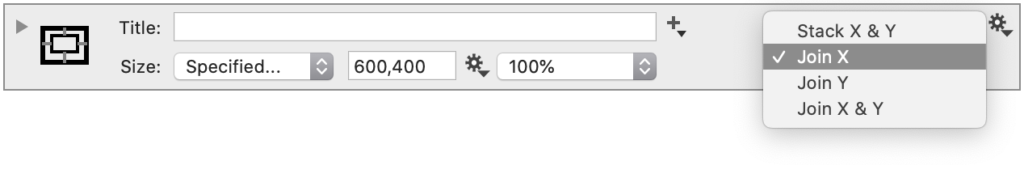
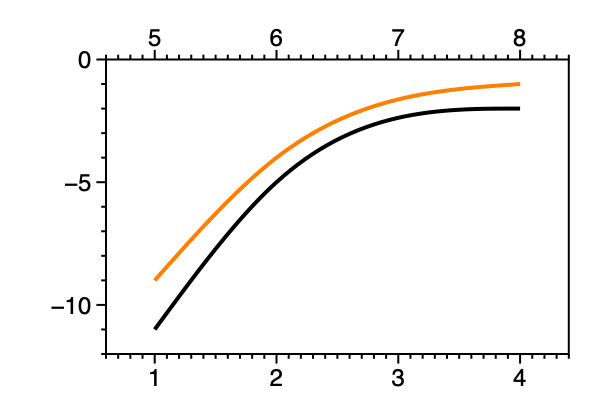
Change the setting to ‘Join X’ to combine.
By default the split x-axis will be shown on the top of the graph.
Axis formatting
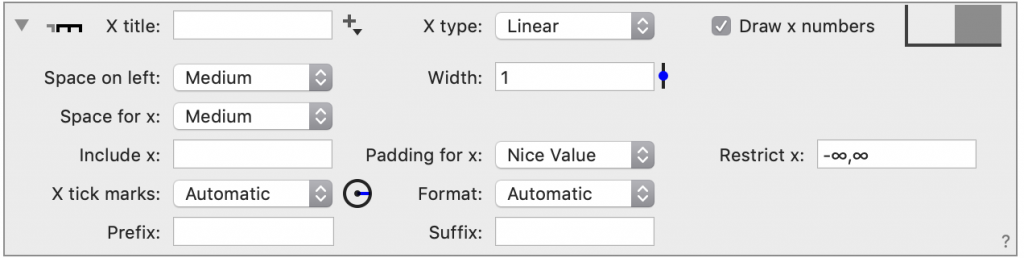
The split-axis objects contain many of the same options as the main Axis settings.
If you need additional formatting options, hide the default axis and use an Extra Axis command.
For example, say you wanted the color of the second or split axis to correspond to the data.
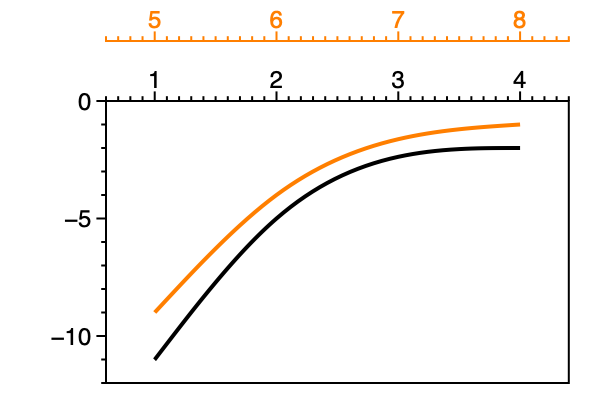
To do this, use two Extra Axis commands.
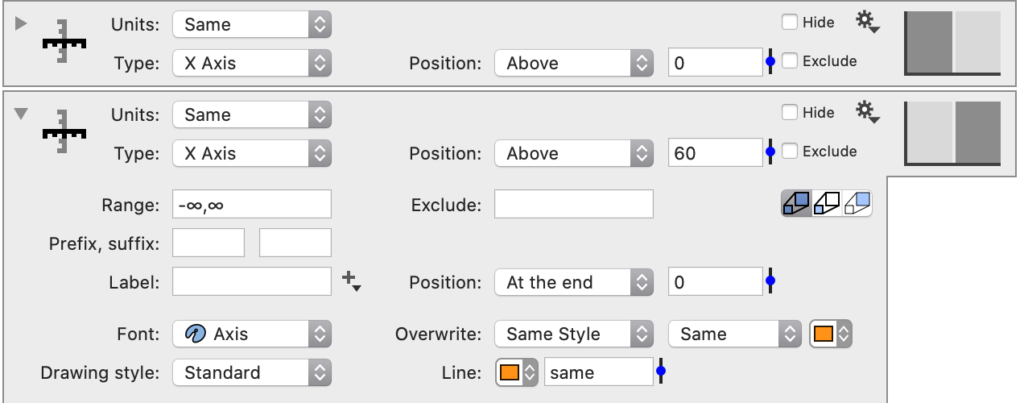
- Unchecking ‘Draw x numbers’ on the Axis settings.
- Add two Extra Axis commands (Command > Add Extra Axis).
- Set the Position to ‘Above’ for both.
- Using the axis selector boxes, move the one command to second axis.
- Add an offset for the second axis and change the colors to correspond to the line and text.