Presentation Mode
To present images from DataGraph in a video conference or using an external monitor, use the Presentation modes under the View menu. These modes allows you to present images that are scaled properly and while maintaining the aspect ratio of the graph.
Presentation Window
The presentation window is separate graph viewer that can be shared on video conferences, such as through Zoom.
Key Features:
- Create a separate presentation window.
- Easily switch between graphs from different files.
- Simultaneously edit/browse graphs while presenting.
To start, select View > Presentation > Present in Window.
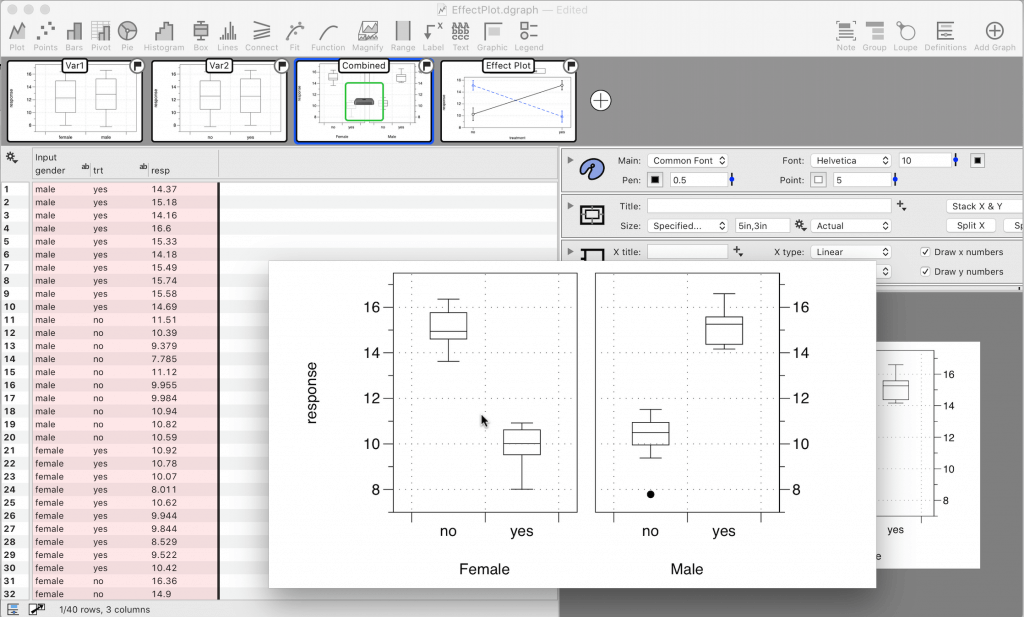
A new presentation window is created that will initially contains the active graph.

In the thumbnails, a presentation icon overlays the graph in the presentation window.

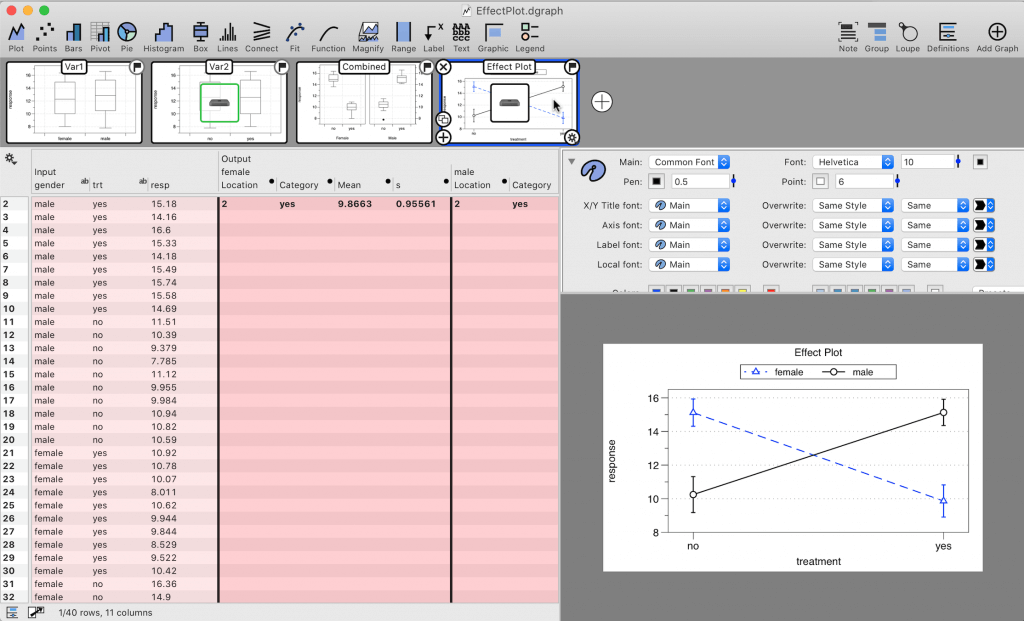
To present a different graph, hover the cursor over the thumbnail and click on the presentation icon.

To change the active graph for editing (outlined in blue), click on the outer portion of the thumbnail, away from the presentation icon.

Now, one graph is in the presentation window, while another graph is active for editing.
To present a graph from another file, simply hover over the thumbnails in that file. The presentation icon will appear as you hover over the thumbnails. Click the presentation icon in the center of the graph you want to present.
To bring the presentation window to the front view, select View > Presentation > Present in Window.
To move the presentation window, click and drag at the toolbar at the top of the window. To close the presentation window, click the red close button in the top left corner.
Use an External Monitor
DataGraph can also be used to present to an external monitor. Control what is shown on the external monitor using the primary display (e.g., laptop).
Key Features:
- Allows you to present to one or more external monitors at once.
- Easily switch between graphs from one more multiple files.
- Simultaneously edit/browse graphs while presenting.
Step 1: Select an External Monitor
Select View > Presentation and select the external monitor based on the schematic shown.
- A schematic is shown for each external monitor.
- The relative size of the monitors is shown.
- The monitor shown in black will be sent the graph.
For example, the following schematic is shown for a system with two monitors connected, the monitors are similar in size, and the monitor to the left will be used for the presentation.

Some things to keep in mind:
- The screen you are using to setup the presentation cannot be selected.
- If you have multiple external monitors, each one listed.
- When a monitor is selected, the active graph will be displayed.
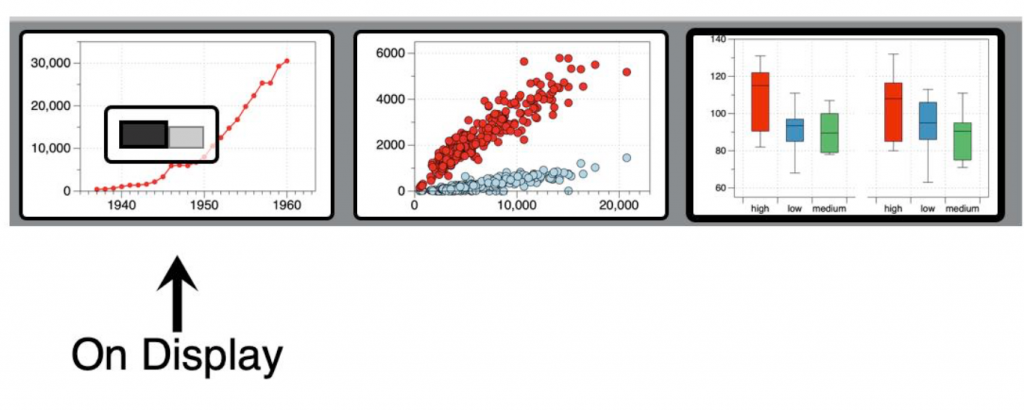
This will show the graph with the current focus on the external monitor. There will be an icon over the thumbnail indicating what is displayed.

The graph size will adjust to fill the external monitor while maintaining the same aspect ratio.

Step 2: Change the Displayed Graph
Hover your mouse over a different thumbnail. After a moment, a representation of the screens will appear. Click the screen icon in the center of the thumbnail to send the graph to that monitor.
Step 3: Control Presentation
While using Presentation mode, DataGraph will continue to look and operate in the same way as before. The only difference is that you will have the small image displayed on graphs that are shown on external monitors.
Since you control what is displayed using the thumbnails, you can continue to work in DataGraph and make changes to other graphs in your file, while a graph is being displayed on the external monitor.
NOTE: You are not limited to using one DataGraph file during the presentation. You can move between DataGraph files to change the displayed graph. You can also open files or even create new graphs to display.
Step 4: End Presentation Mode
Under View/Presentation, select the same external monitor to stop displaying OR hit the ESC key.