DataGraph
-
Getting Started
-
User Interface
-
Data
-
Columns
-
Variables
-
Commands
-
Layout settings
-
Customize
-
Functions
-
Exporting
-
Scripting
-
Beta
-
Versions
-
Join the Community
Print
How to Sort a Column
Updated
Columns can be sorted individually, or one column can be used to sort multiple columns at once.
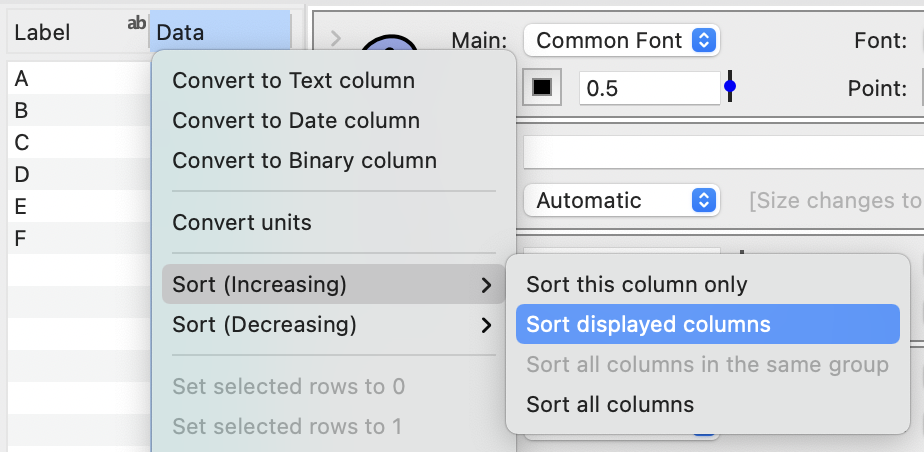
To change the sort order in the data table:
- Right click on a column heading (or click the gear menu in the column list)
- Select Sort (Increasing or Decreasing)
- Select from the sort options:
- Sort this column only
- Sort displayed columns
- Sort all columns in the same group
- Sort all columns
Number, text, and date columns can all be sorted in this way.
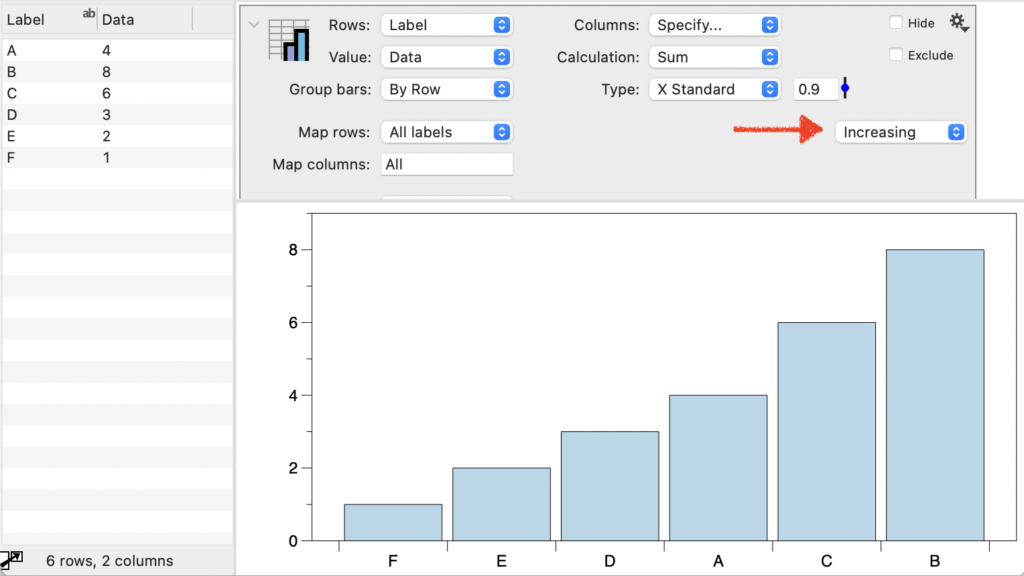
If you are plotting data using the row number (‘#’), or using a Bars command, changing the sort order in the data table will change the order in the graph.
For example, changing the sorting order changes the order in the Bars command. Selecting to sort all columns, changes the order of the data and the corresponding labels.

Note that the Pivot command has the option of sorting dynamically, without having to sort in the data table.
On This Page