How to Fill with a Series
You can fill a column of data with a linear series of numbers in DataGraph, using two basic techniques:
- Method 1: Fill a selection of rows
- Method 2: Use an Expression column
The first approach is similar to what you might do in a spreadsheet, but the second is very fast and flexible. Here are some examples.
Fill a Selection
You can fill in a column after you type the first two entries in a series. This fills the rows that are selected, instead of typing all the values.
Example 1: Using an empty file, create an incremental series: 1, 2, 3, …
Steps:
- Type 1 and 2, in the first two rows
- Select the rows you want to fill (Shift-click to select)
- Control-click on the header
- Select ‘Set selected rows to 1, 2, 3, …’
Example 2: Build on the last file, create an incremental series: 2, 4, 6, …
Steps:
- Type 2 and 4, in the first two rows
- Select the rows you want to fill (Control-A to select all)
- Control-click on the header
- Select ‘Set selected rows to 2, 4, 6, …’
Create an expression
The examples below replicate the lists above using this technique.
Example 1: Using an empty file, create an incremental series: 1, 2, 3, …
Steps:
- Set the expression to the row counter, ‘#’
- Set the number of Rows
Example 2: Build on the last file, create an incremental series: 2, 4, 6, …
Steps:
- Option-Drag the existing expression (Creates a copy)
- Change the expression to ‘#*2’

NOTE: In these examples, you must specify a column length. As the only input is the row counter ‘#’. Expression that use other data column that already have a fixed length will not require a column length.
Advanced Expressions
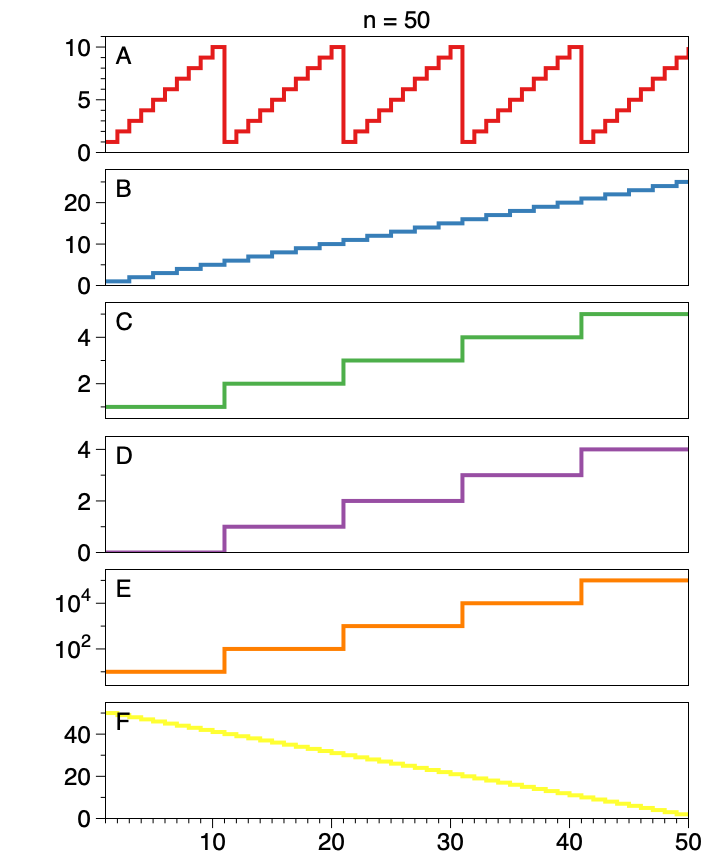
You can do more complicated patterns by using functions in your expressions. Here are some examples:
| List | Expression |
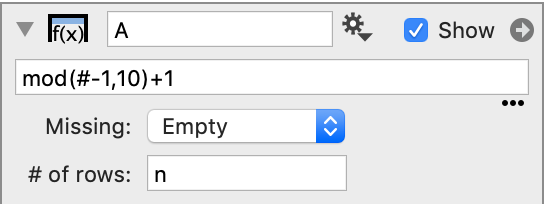
| A | mod(#-1,10)+1 |
| B | ceil(#/2) |
| C | ceil(#/10) |
| D | ceil(#/10)-1 |
| E | 10^ceil(#/10) |
| F | n-#+1 |
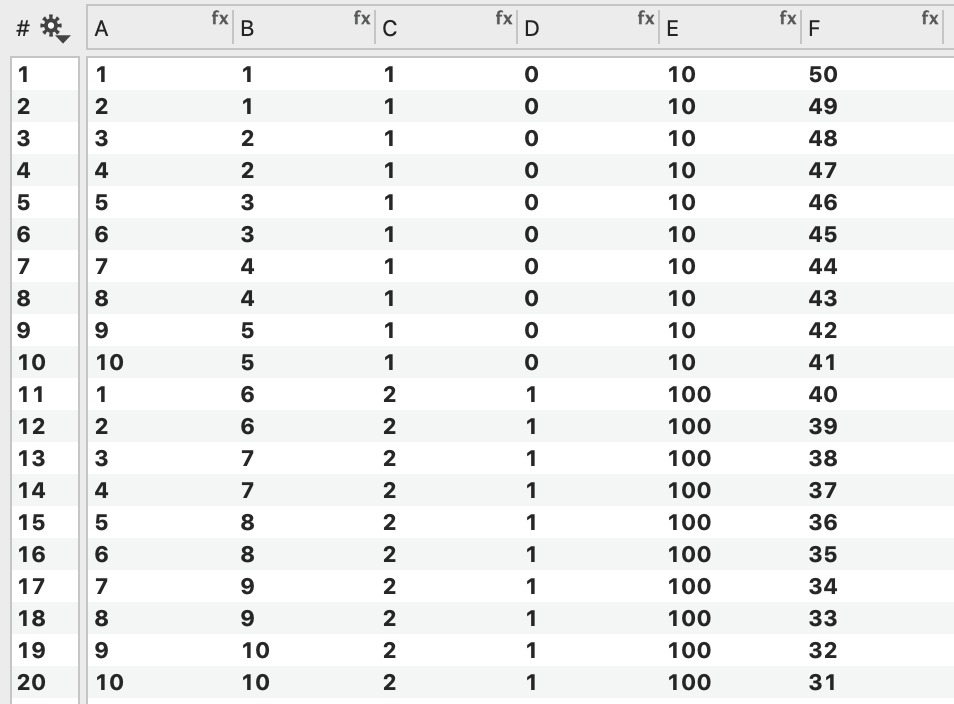
Column A uses the mod function (remainder after division). Several of the expressions use the ceil function (the nearest integer above the value).
You can set the ‘# of rows’ to a variable (e.g., n).
Then you can change the length for all of these lists at once.
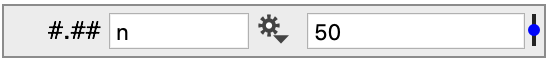
For example, here are all the lists plotted when the length is 50.