The Commands
The Toolbar
Across the top of the toolbar are command shortcuts.

Command Lists
The menu bar contains a full list of the commands from the Command menu. The commands are organized into two lists on the toolbar: Draw and Label.
Exercise:
- Click the Draw button
 to view a list of drawing commands
- Click the Label
 button to view a list of commands for annotating graphs
- Find a command you’re interested in and click the associated ‘?’ to view the help page
Shortcuts
Clicking icons to the right of Draw and Label adds commands directly to your graph – the same as using the ‘Add’ button in the lists.

This section of the toolbar shows a subset of commands. You can customize it to include the ones you frequently use.
See How to Customize the Toolbar.
Adding Commands
Adding a command creates an object below the layout settings. Commands include interactive menus, sliders, and entry boxes for customization.

Example 1: Plot & Label
Create a line plot with a label pointing at one data point.
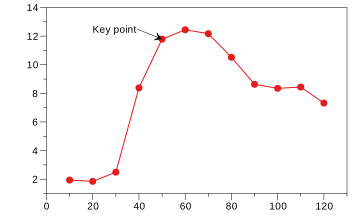
| X Value | Y Value |
|---|---|
| 10 | 1.94 |
| 20 | 1.85 |
| 30 | 2.49 |
| 40 | 8.38 |
| 50 | 11.79 |
| 60 | 12.44 |
| 70 | 12.17 |
| 80 | 10.52 |
| 90 | 8.63 |
| 100 | 8.35 |
| 110 | 8.44 |
| 120 | 7.32 |
Add the Data
- First, select and copy the above table
- Open a DataGraph file
- Go to Edit > Paste (⌘V)
Add the Line Plot
- Click the Plot command icon

- On the command object, select the X and Y input
- Format the line (e.g., color, points, line width)
Add the Label
- Click the Label command icon

- On the graph, click and drag to position the Label
- Double-click the label text to edit
When you are done, the command objects should look something like this.
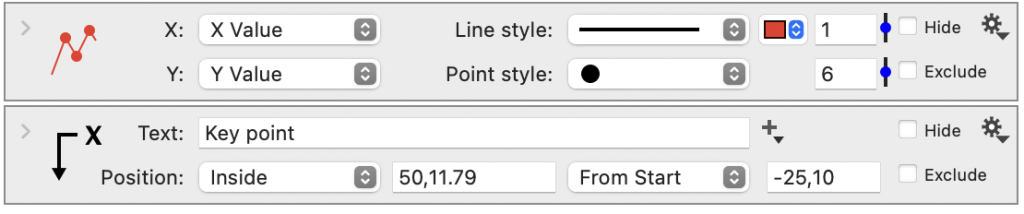
Notice how the icon on the Plot command changes to reflect the drawing options (e.g., points, color). Many commands have similar custom icons, making tracking the associated elements in the graphs easier.
Example 2: Bar & Line Graph
This example shows how to add a bar and a plot command to the same graph. You can also add a legend.
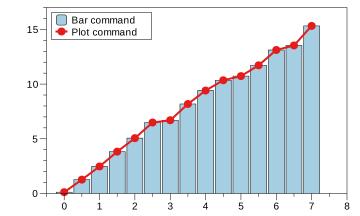
| X Value | Y Value |
|---|---|
| 0.0 | 0.121 |
| 0.5 | 1.267 |
| 1.0 | 2.472 |
| 1.5 | 3.825 |
| 2.0 | 5.060 |
| 2.5 | 6.488 |
| 3.0 | 6.697 |
| 3.5 | 8.182 |
| 4.0 | 9.410 |
| 4.5 | 10.351 |
| 5.0 | 10.731 |
| 5.5 | 11.716 |
| 6.0 | 13.116 |
| 6.5 | 13.531 |
| 7.0 | 15.317 |
Add the Data
- First, select and copy the above table
- Open a DataGraph file
- Go to Edit > Paste (⌘V)
Add the Bar command
- Shift-click the headers to select the data
- Click the Bar command icon

Add the Plot command
- Repeat step 4
- Click the Plot command icon
Add the Legend
- Click the Legend command icon

- Change the Anchor to ‘Upper Left’
- Click the drag the Legend to change the offset
- Click and drag the Legend edge to change the width
- Double-click the text on the legend to edit
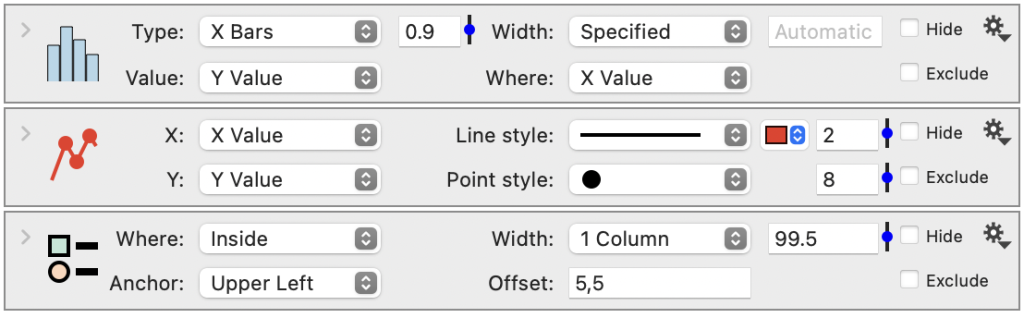
Pen and Point
DataGraph uses variables to propagate the line width and the point size throughout the commands in your graph. This makes it easy to change the sizes globally throughout your graph, in the Style settings.

You’ll see this when you add commands where the words pen and point are used for setting line width and point sizes. This means the value for that setting in the command will be equal to whatever the value is in the Style settings.
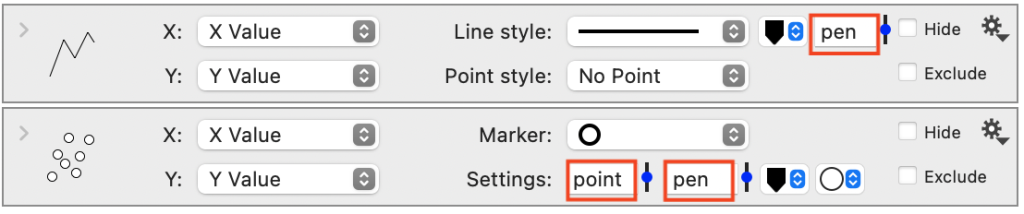
If you enter a different value or use a slider to change the line width or point size that will break the connection with the style settings.
Some things to try:
- Use the sliders to change the line width or point size on the commands
- Type in the variable names to go back to using the pen or point variable
- Create your own variables to use for the settings
- Enter a multiple of the variables, 2pen