Range
Range can be used to highlight a coordinate region in x and/or y. It is also possible to use it as a basic building block.
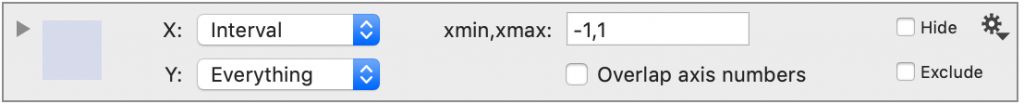
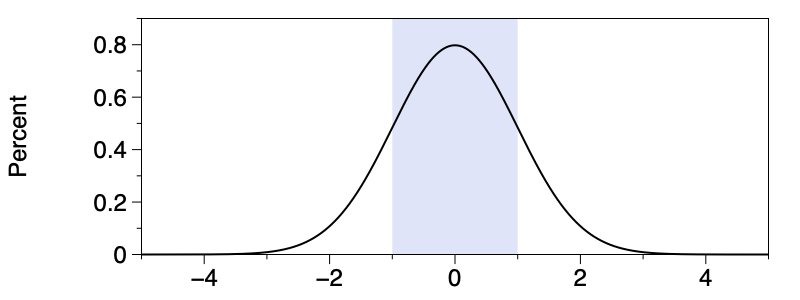
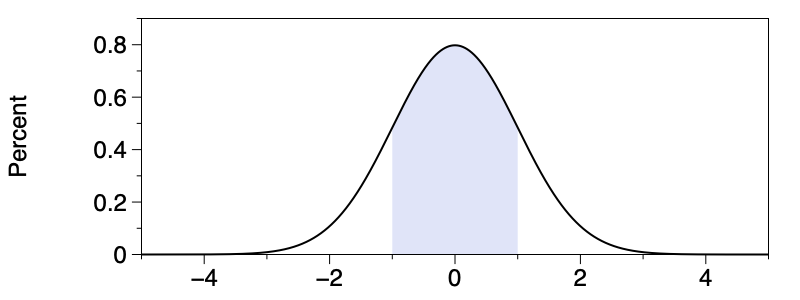
In the simplest case you specify a single interval in either the x or y direction.
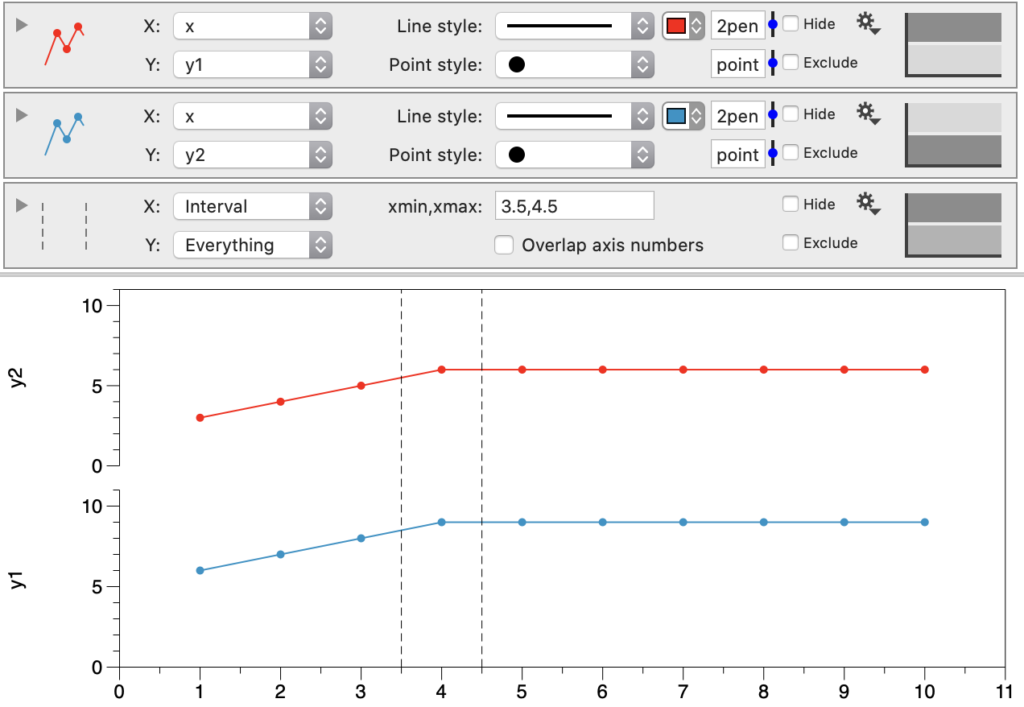
You can drag the edges of the interval with the mouse. As with all numerical fields, you can use variables when specifying the range. You can specify the range in both x and y directions, so you can use this to draw rectangles, and semi- or in-definite rectangles by specifying one or both ends to be infinity.
Input
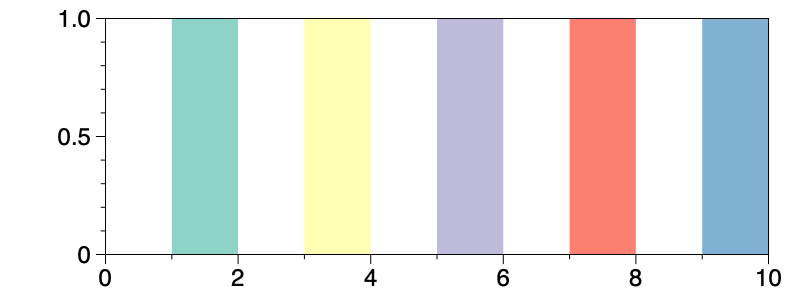
There are also other ways to specify intervals using the menu on the left side. Alternates means that you can color the intervals [0,1], [2,3], [4,5],… without having to use multiple range commands.
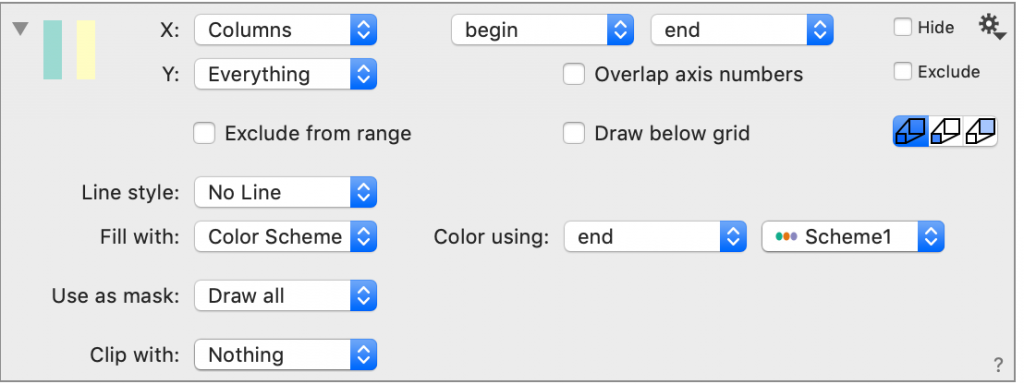
For X and Y you can choose:
- Everything – fills entire axis
- Interval – fills one area
- Alternates – fills multiple alternating areas
- Dates – fills alternating time frames (i.e., years, weeks)
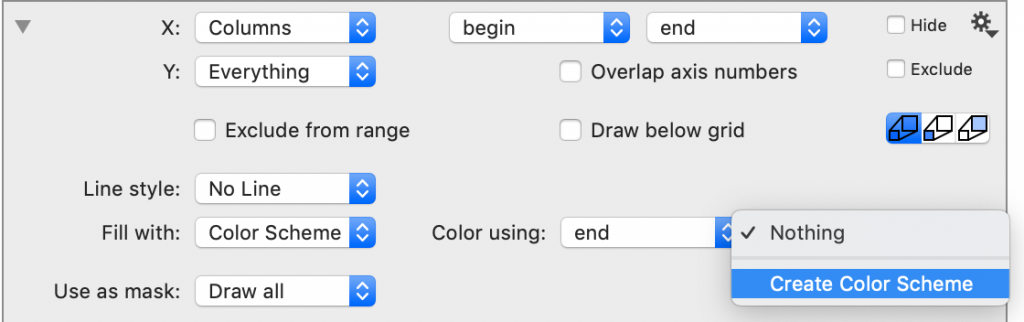
- Columns – select data columns to specify the begin and end ( this is the only option that will work with a color scheme)
By default, the Y is set to ‘Everything’, such that the highlighted region spans the entire y-range. When you have a Split Axis, the region command spans every axis.
Fill with
You can color the range(s) in various ways:
- solid
- gradients
- patterns
- noise
The Dates option allows you to specify alternating fills based on dates.
For full flexibility use the Columns option. This allows you to specify columns for the start and end of each interval. Each row gives you an interval.
Clip with …
A slightly advanced use, is to use the clipping action to fill a portion of a plot. This is done by using two drawing commands. One draws the plot, the other draws the region but clips the result with the output of the plot command. This is done by selecting the command from the ‘Clip with’ menu at the bottom of the Range command.