-
Getting Started
-
User Interface
-
Data
-
Columns
-
Variables
-
Commands
-
Layout settings
-
Customize
-
Functions
-
Exporting
-
Scripting
-
Beta
-
Versions
-
Join the Community
Organizing Data
A column group allows you to organize data columns.
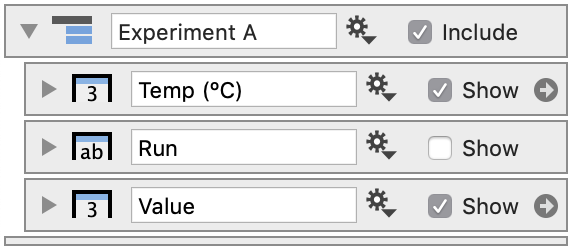
Add Column Group
STEP 1: Click and drag to select columns in the data side panel.
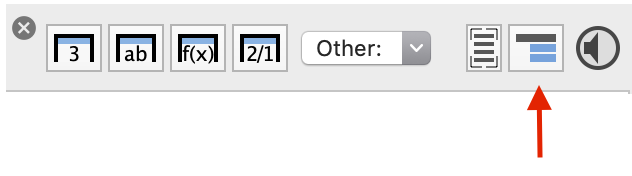
STEP 2: Click the shortcut above the column list.
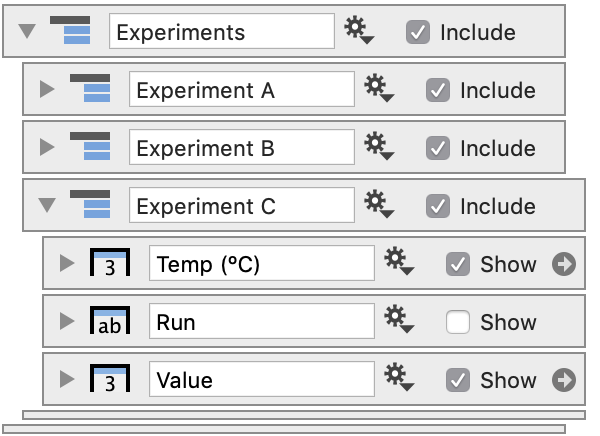
Here, you can see two groups created. At the end, both groups are selected and collapsed using the left arrow key.
You can also drag column objects into and out of the group.
You can nest groups inside other groups to create a hierarchical data structure.
The groups can also be dragged to move multiple columns at once.
Use the Include button to hide or display groups on the data table.
Even drag a group onto a command to replace all the data used by that command or group of commands.
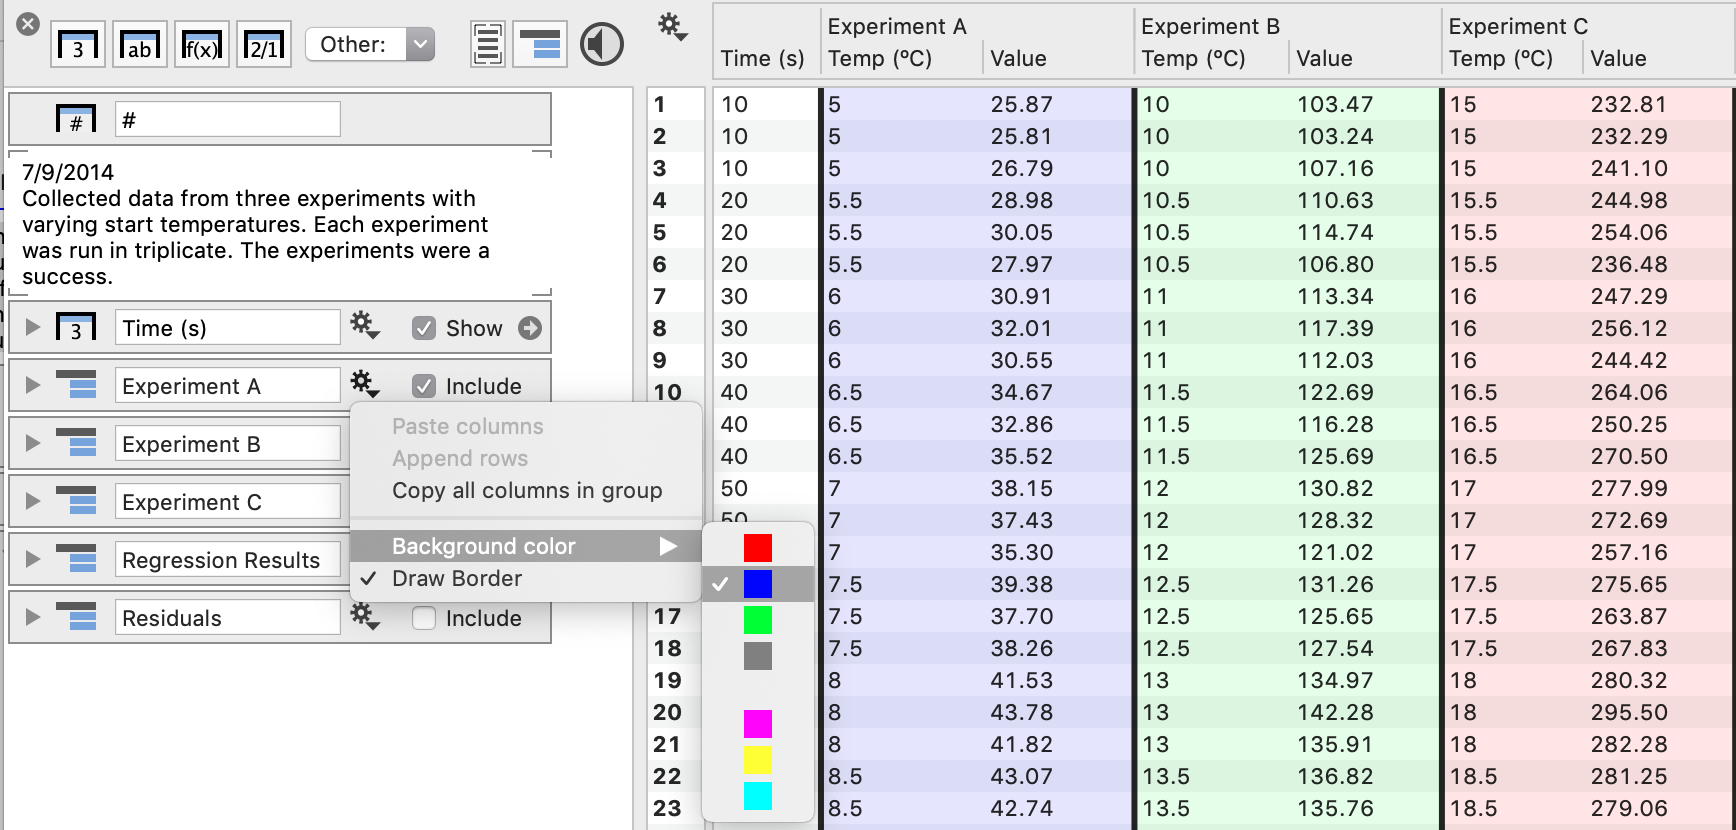
Background color
You can customize the background color shown in the data table for a group by using the gear menu to get a list of colors.
Note: Placing columns in a group will not affect connections to drawing commands; however, columns referred to in Expressions could be affected.
Learn more: How to use path names in expressions.