-
Getting Started
-
User Interface
-
Data
-
Columns
-
Variables
-
Commands
-
Layout settings
-
Customize
-
Functions
-
Exporting
-
Scripting
-
Beta
-
Versions
-
Join the Community
How to make a Line Graph
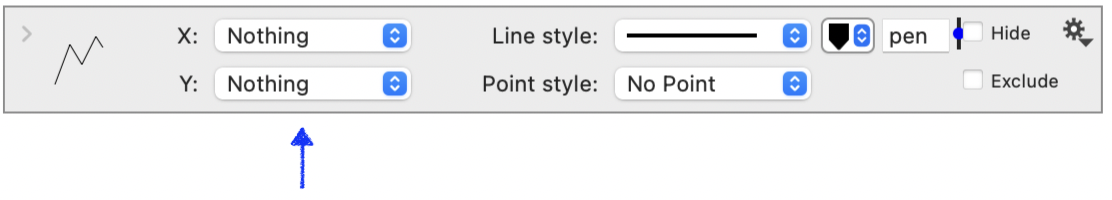
To plot a single line in DataGraph, use the Plot command. Like many commands, the plot command can also be used to draw labels.

On the command, use the menus to select data, one for X and Y.
You can also pre-select the data as demonstrated below.
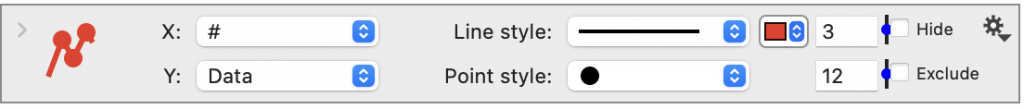
One Column
Quickly plot a sequence of numbers along the x-axis.
- Click the column header.
- Click the Plot command shortcut or Command > Add Plot.
In this case, X is the row number, ‘#’, and Y is the ‘Data’ column.
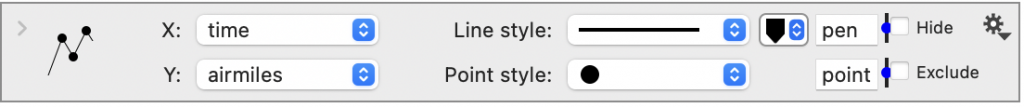
Two Columns
Highlight both columns and click the Plot command shortcut.
- Click the first column header.
- Command-Click the second column header.
- Click the Plot command shortcut or Command > Add Plot.
This video also shows how to add axis titles using tokens in the Axis settings.
Here is the Plot command where X = time and Y = airmiles.
Add Labels
Click the top left of the command to reveal more options, including adding labels.
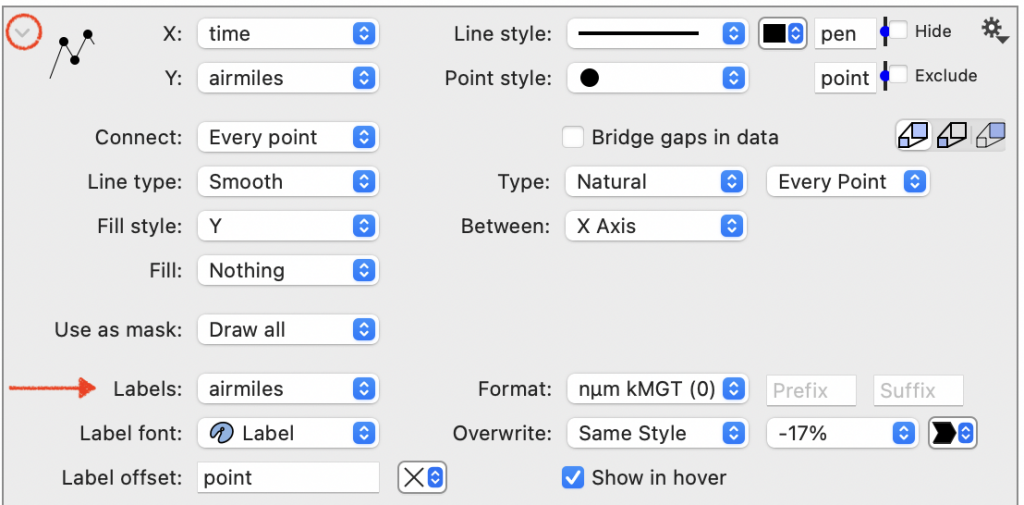
This video demonstrates how to add and format the labels.
At the end of the video, the box style is changed ‘Offset axis’ by control-clicking on the graph. The box style can also be customized in the Style settings.
For more options, see the Plot command documentation in the Reference manual.