DataGraph
-
Getting Started
-
User Interface
-
Data
-
Columns
-
Variables
-
Commands
-
Layout settings
-
Customize
-
Functions
-
Exporting
-
Scripting
-
Beta
-
Versions
-
Join the Community
Print
How to make a Pie Chart
Updated
Make a pie or donut chart with the Pie command.
One Column of Numbers
Step 1: Highlight a column of numbers.
Step 2: Click the Pie command shortcut.
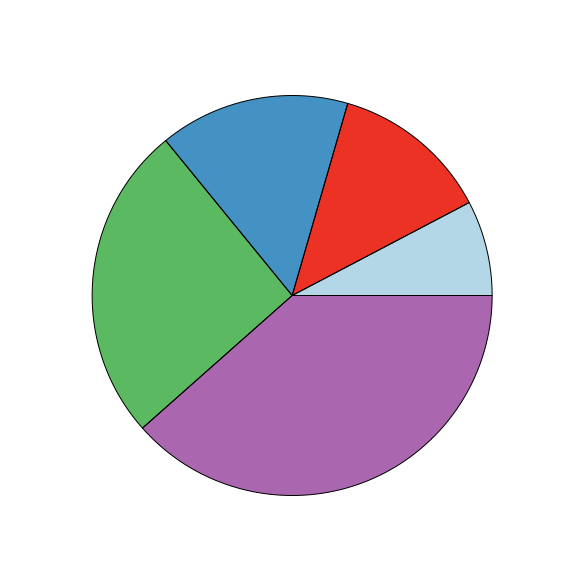
This will make a single Pie chart with no labels.
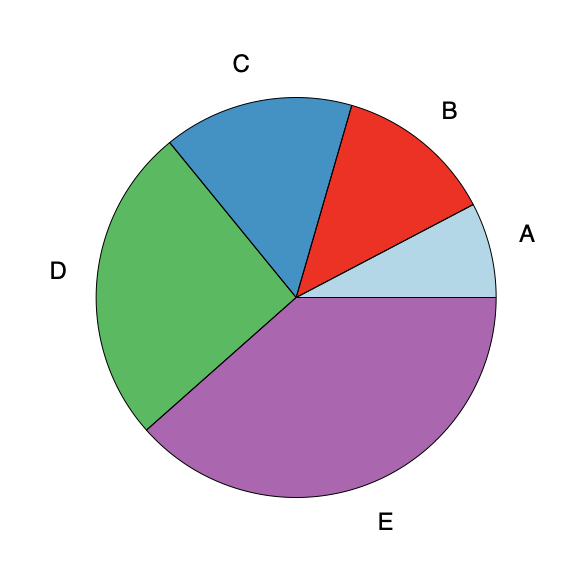
Labels and Numbers
If you have a text column with labels on the left of the data, highlight both columns and then click the shortcut.
Pie charts can easily be combined with other graphs.
The width and radius of the pie can be varied for all slices, or for individual slices. You can also use color schemes and change the labels.
For more information, see the Pie command documentation in the Reference manual.
Updated
On This Page