How to Add an Axis Break
A graph with an axis-break has two separate regions of the axis shown, often with different scales.
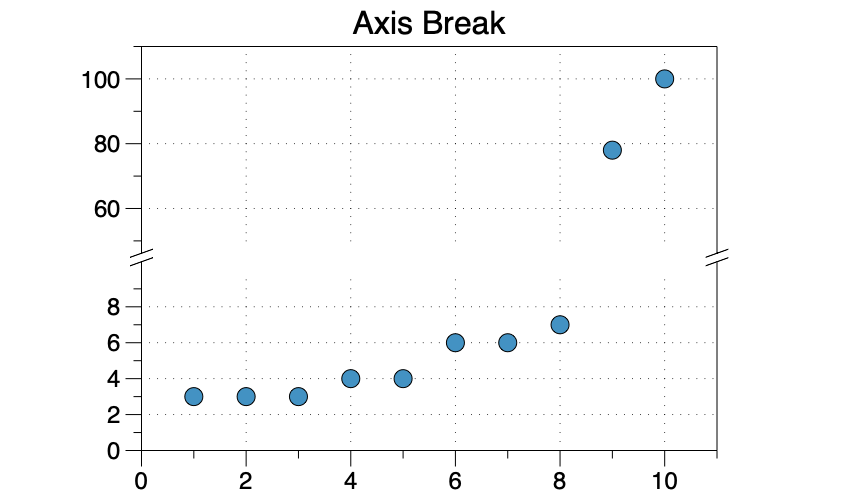
This is not a drawing mode, but rather you get the look of an axis-break by plotting the data on two axis, while zooming and adjusting the axis scales.
Case 1: Two Commands
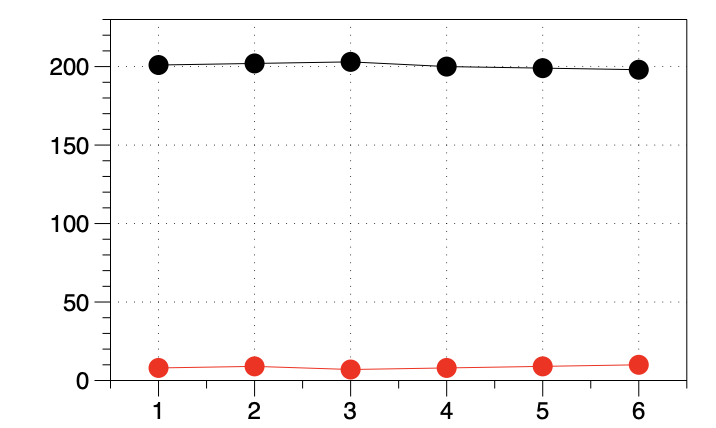
Here are two lines, drawn using two Plot commands.
Here is the same data drawn with an axis-break.
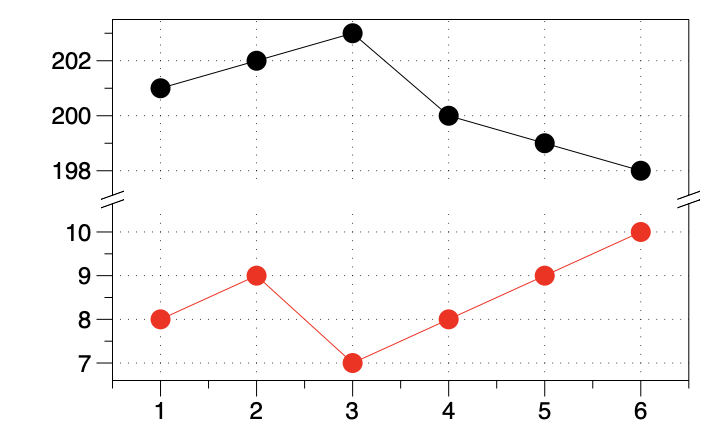
Here are the steps to create the break:
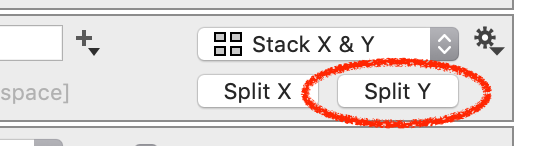
- Click the Split-Y button on the Canvas settings.
- Using the axis selectors, move one command to the split-axis.
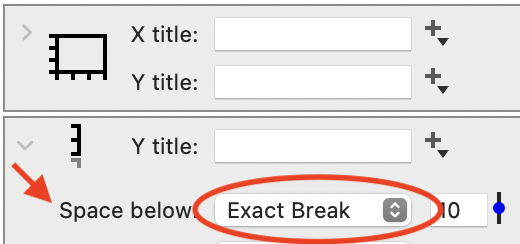
- Expand the new axis object, change the Space below to ‘Break’.
For multiple breaks, repeat the above steps.
Case 2: One Command
Another possibility is that you have data drawn by a single command. For example, a Points command with points on either side of the break you want to add.
Video Demo
The video shows how to create an axis-break in the Y-direction, where you have one Points command, having data that will span the break.
The basic approach is:
- Split the Y-axis
- Add the same command to each axis
- Restrict the range in each axis as needed
NOTE: This video does not have audio.
Detailed Steps
Step 1: On the Canvas settings, click Split Y.
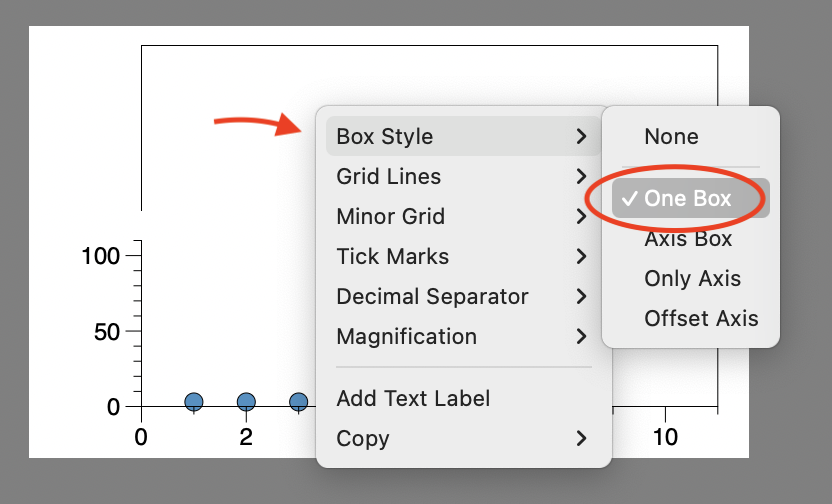
Step 2: Ensure the Box Style is set to ‘One Box’ in the Style settings. Otherwise, you will not see the break lines after Step 3. A shortcut is to control-click (right-click) on the graph to change in the context menu.
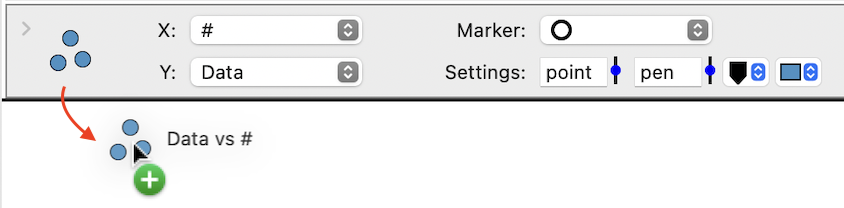
Step 3: Make a copy of the command. As demonstrated in the above video, you can quickly do this by holding down the option key while you click and drag the command down.
Step 4: Once you have the two commands, use click the axis selectors on the right to place one in the above axis.

Step 5: On the settings for the split axis, change Space below to ‘Break’ or ‘Exact Break’.
The graph should look something like this.
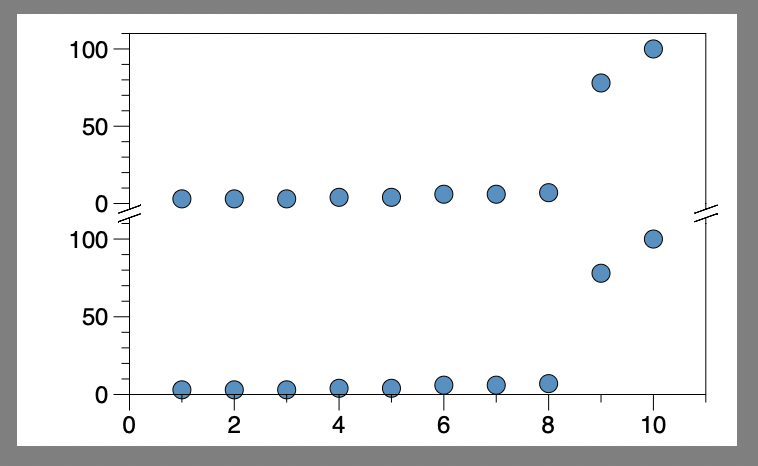
Step 4: Modify the Restrict settings on each axis to get the desired range.
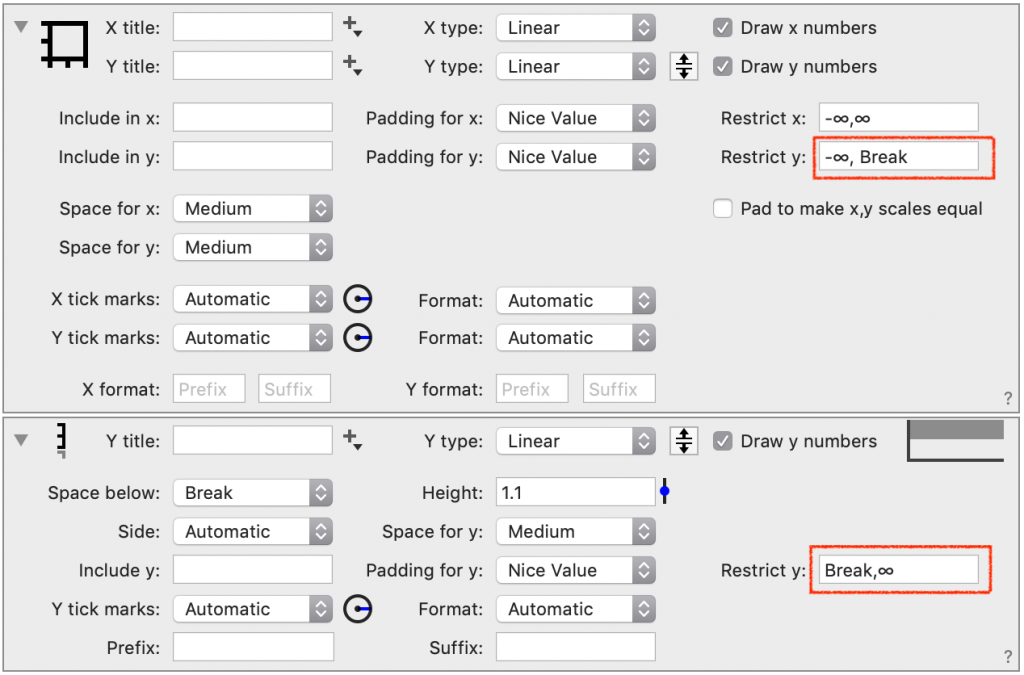
On the main axis (bottom graph), set the max value.

On the split axis (top graph), set the min value.

NOTE: The range can also be changed interactively. Click and drag on the graph, as shown in the above video.

Step 5: Adjust the size of each graph using the Height on the axis settings.


Using a Variable
Use a slider to make it easier to set the end of the bottom axis and the beginning of the top axis to the same value to ensure you do not leave out any data.
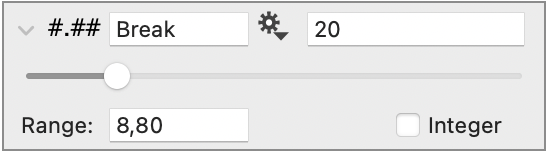
Here, the slider ‘Break’ is used in the Restrict settings of the main axis and split axis settings, as shown below.
Example Files
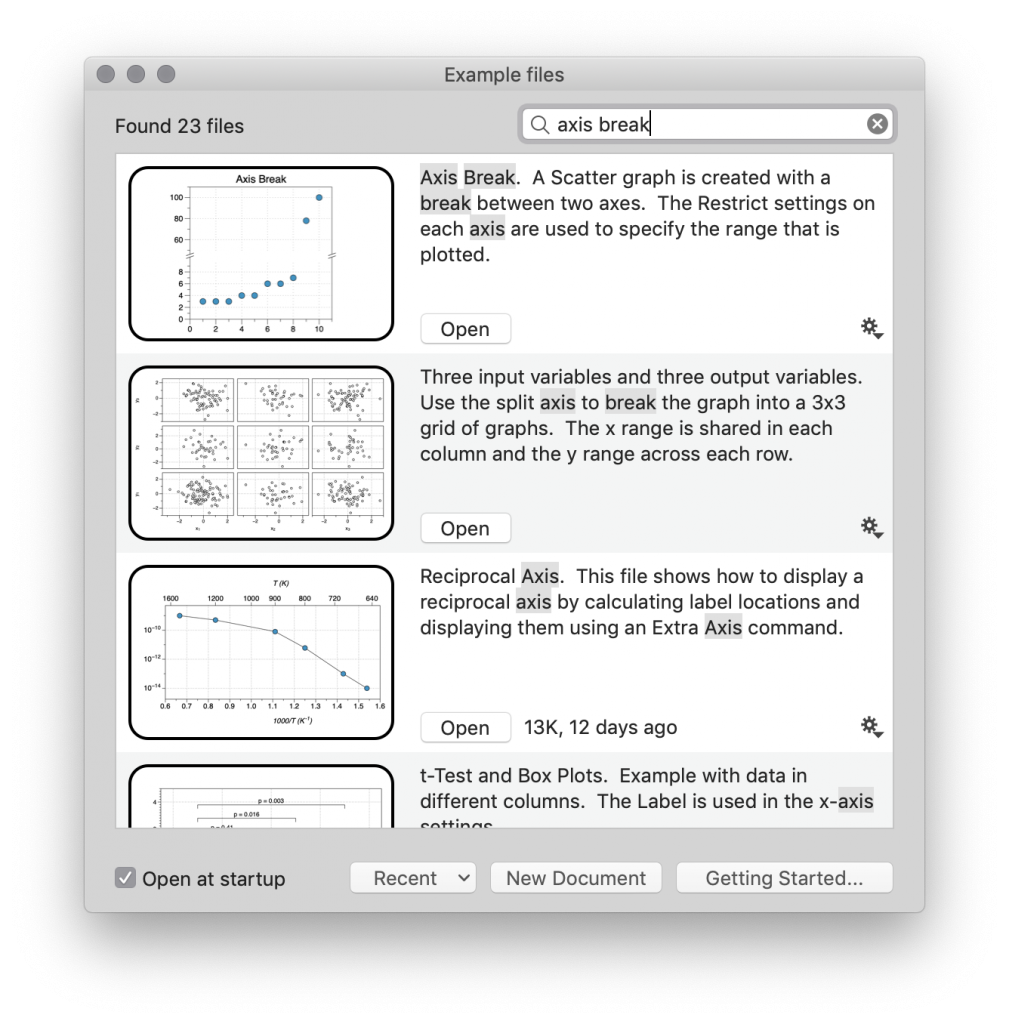
In DataGraph, go to File/On-line Examples and search ‘axis break’ to download example files.