Number from Column
The Number from Column global variable allows you to extract values or calculate summary statistics from a column of data.
When you create a Number from Column variable, you must specify the column of data you want to use and the type of value you want to display.

How to Create
Manual Method
Step 1: Create the variable
Click the Other menu in the variables section at the bottom of the data side panel. Select ‘Number from Column from the list.

This will create the variable with a red dot in the corner.

Step 2: Select the column
From the Column menu, select a column. You will also need to name the variable.
Here, the variable ‘Total’ returns the value 35, which is the sum of the column ‘My Data.’


Step 3: Select what to compute (Optional)
By default, this variable will compute a sum. If that is what you want, there’s nothing else to do. To calculate a different summary statistic, select that from the What menu.
Shortcuts
You can create the variable and populate the menus in one step from the data side panel or the data table.

Method 1: From the Data Side Panel
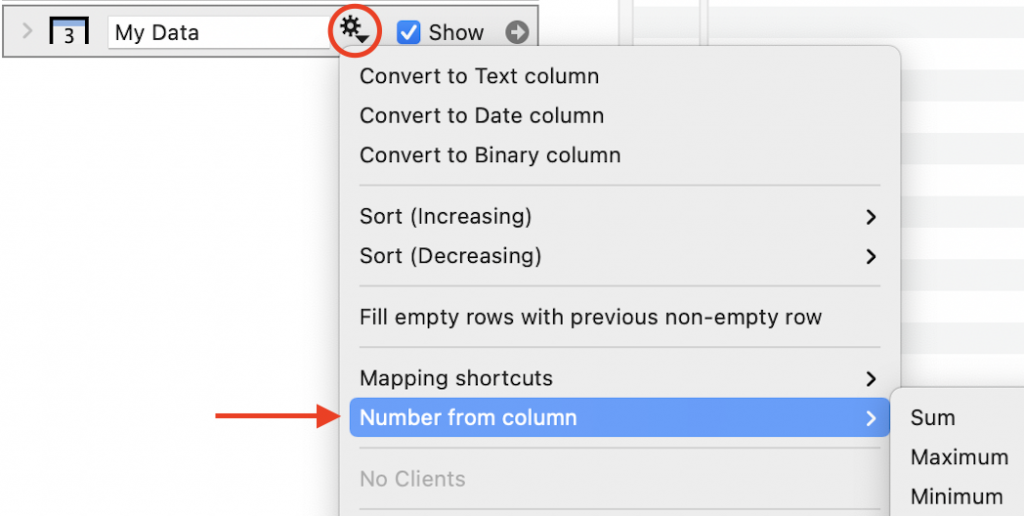
Click the gear menu on a column object. Select ‘Number from Column’ followed by what you want to calculate (sum, max, min, … ).

Method 2: From the Data Table
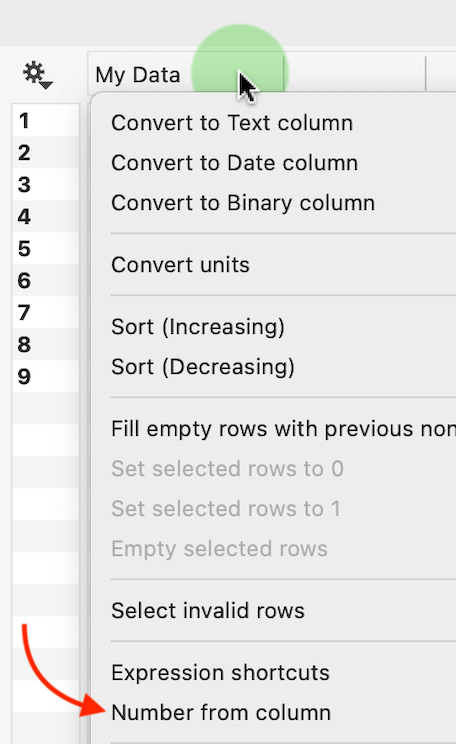
Control-clicking (right-click) on a column header in the data table. This will show the same menu as clicking the gear menu.

Examples
Here are some examples of using the variable in a graph.
Example 1: In a Text Field
To display in a text field, click the “+” symbol to the right of any text entry box and select from the drop-down menu. This will add a token.
Here, the token is added to the Title field.

Example 2: As a Number
You can also use these variables in any entry box that accepts numeric values.
Here, the value for the mean is computed using a variable called ‘Mean’.

A Lines command is used to display the mean value along with a Bar command.

Output
Use the What menu to specify the value you want to derive or return.
| Name | Description |
| sum | sum of all values in a column |
| sum of ^2 | sum of the squares of the values |
| max | maximum of a column |
| min | minimum of the column |
| max | maximum of a column |
| range | maximum minus the minimum |
| count | Number of non-empty rows |
| # of rows | Total number of rows (including empty) |
| mean | Mean of the column |
| median | Median of the column |
| σ | Population Standard deviation |
| s | Sample Standard deviation (unbiased estimate of σ) |
| sem | Standard error of the mean |
| At index … | Return a value from a specific row |
At Index …
You can also extract a single numeric value from a row by specifying the index for the row. This feature can be useful for animations or scrubbing through a data set with a slider.

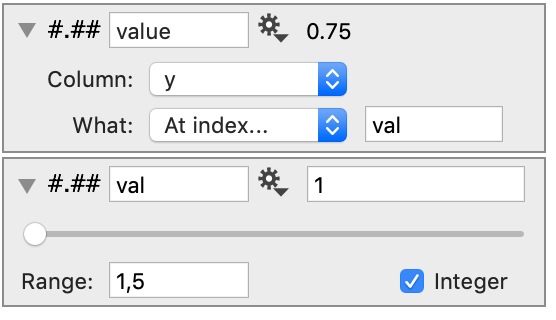
To use, set the index to a slider variable and restrict that to an integer.

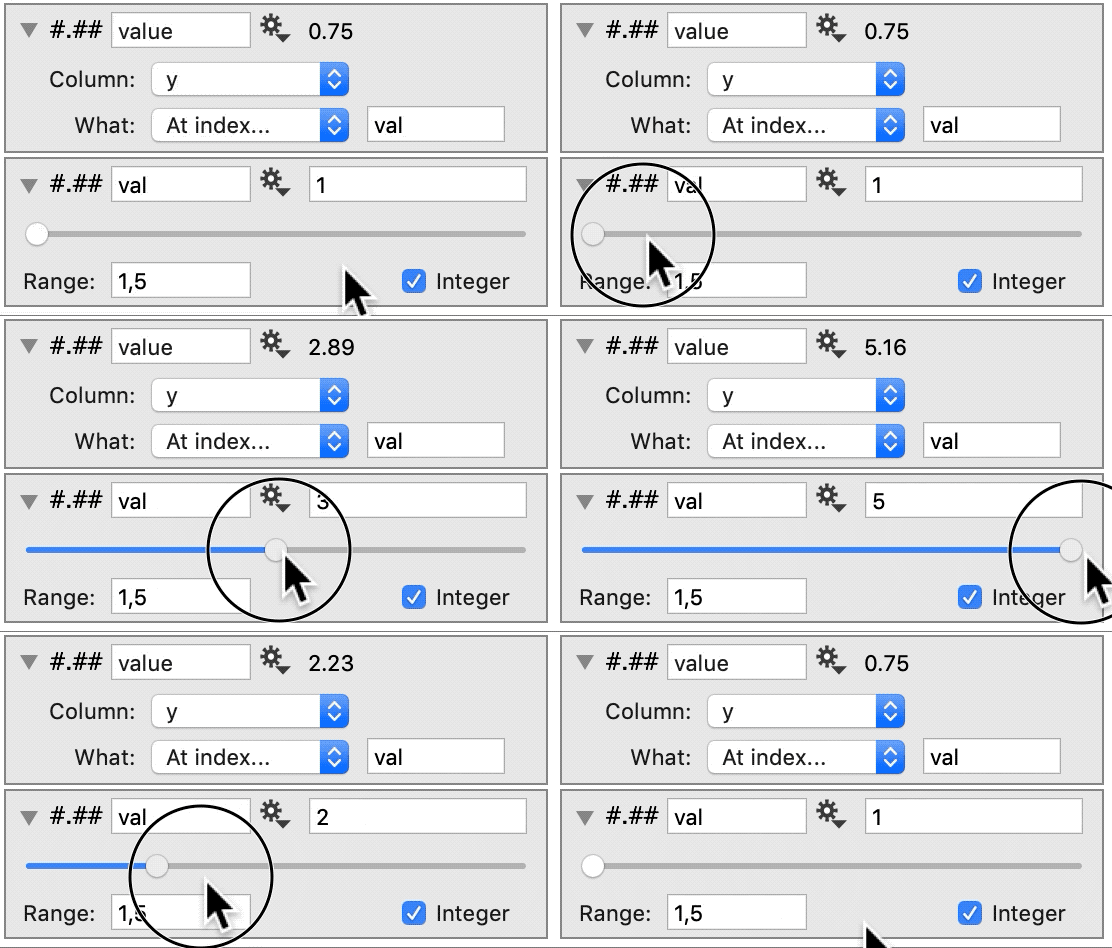
Then, use slider scrub through the rows.

Notice how the value changes when we move the slider.