DataGraph Reference Manual
-
Getting Started
-
User Interface
-
Input
-
Data Types
-
Data Actions
-
Data Exploration
-
Calculations
-
Graph Settings
-
Common Elements
-
Core Graphing
-
Annotating
-
Data Analysis
-
Functions & Fitting
-
Staying Organized
-
Exporting
-
Scripting
-
Beta
-
Join the Community
-
Under Review
- Articles coming soon
Print
Separate Graph Window
UpdatedJanuary 17, 2024
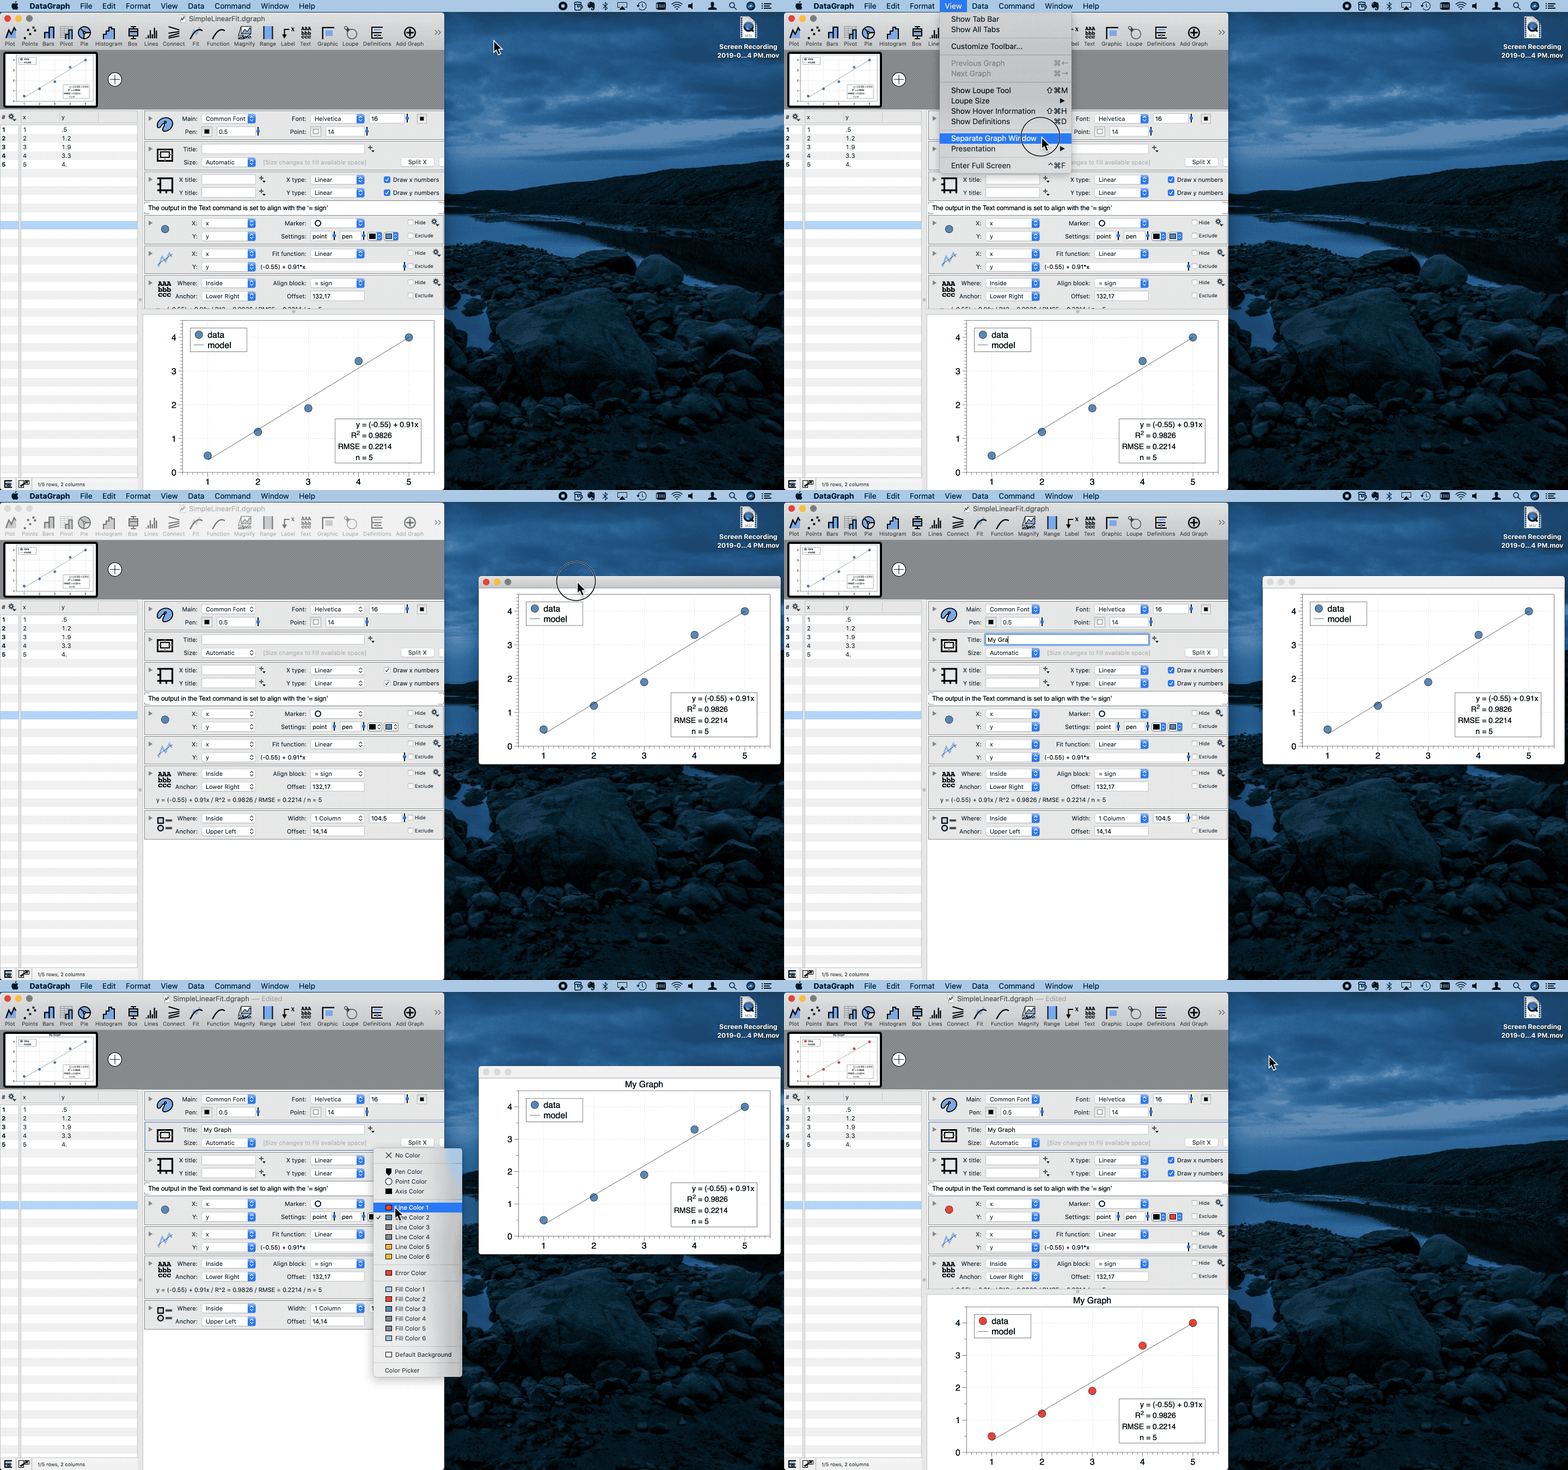
To separate the graph window select View/Separate Graph Window.
Move the graph to another monitor or minimize the DataGraph interface to edit on the same screen.

Once separated, you can:
- Resize the graph
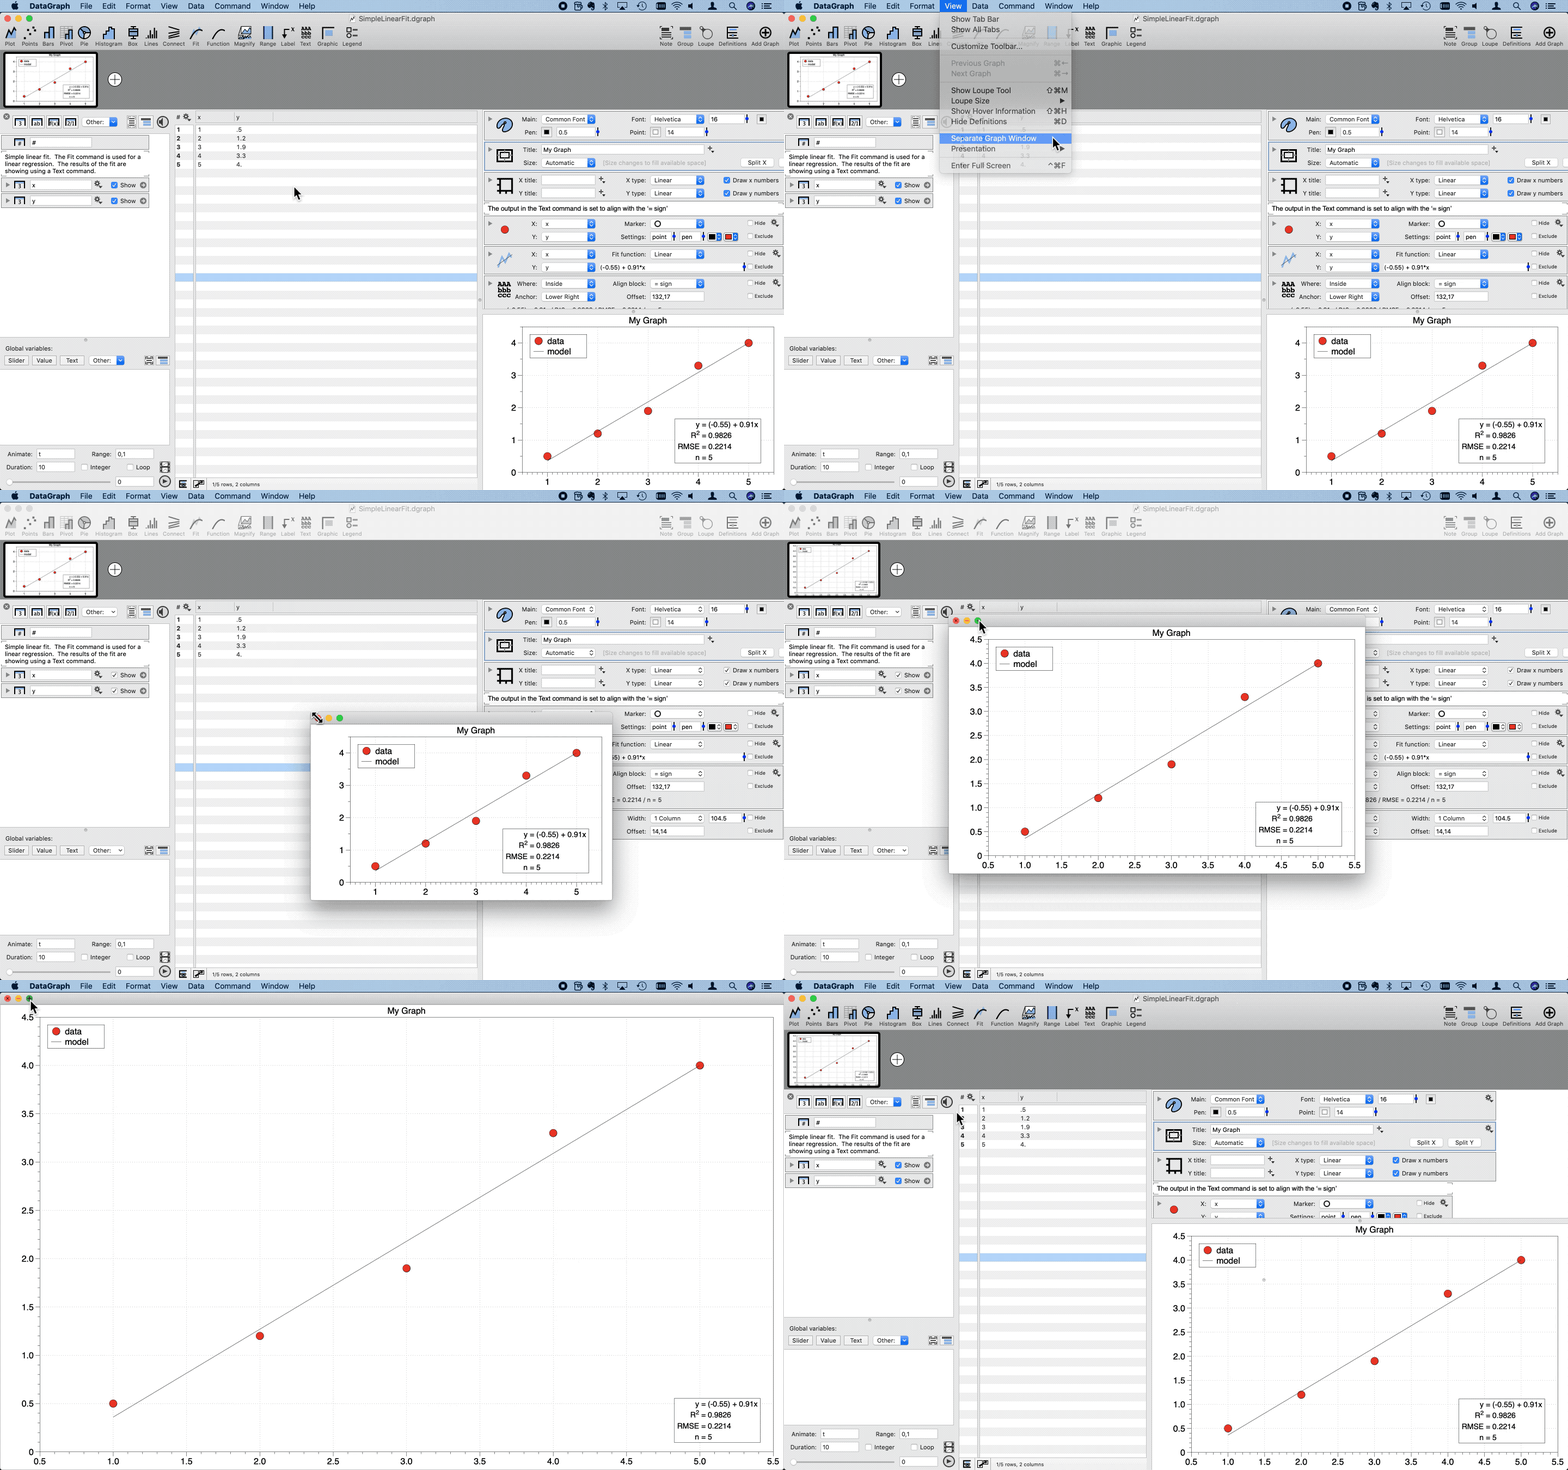
- Click the green button to maximize
- Click the red button to dock the graph

NOTE: The separated graph window could be used for a presentation in a video conference or dragged onto an external monitor; however, the graph size may not scale properly with the screen as the font get relatively smaller as the graph window is increased, as shown in the above animation.
To solve these problems, the program includes presentation modes designed for both scenarios (video conference and external monitors) that will scale the graph for presentations and work across multiple files.
See Presentation Mode for more information.
On This Page