The R-DataGraph Package
Use DataGraph as part of your workflow in the R statistical computing program (https://www.r-project.org). The DataGraph R package allows you to directly integrate output from the R language with DataGraph.
After installing the DataGraph package, you can include commands in R scripts to pipe data from R data frames into external data files that are read by DataGraph. These external files are easily imported into DataGraph (i.e., drag and drop on to the column list) and will automatically update in DataGraph when the data is modified in R.
Access the DataGraph Package on CRAN:
https://CRAN.R-project.org/package=DataGraph
Installation
To install the DataGraph package from the R command line, type the following.
install.packages('DataGraph')
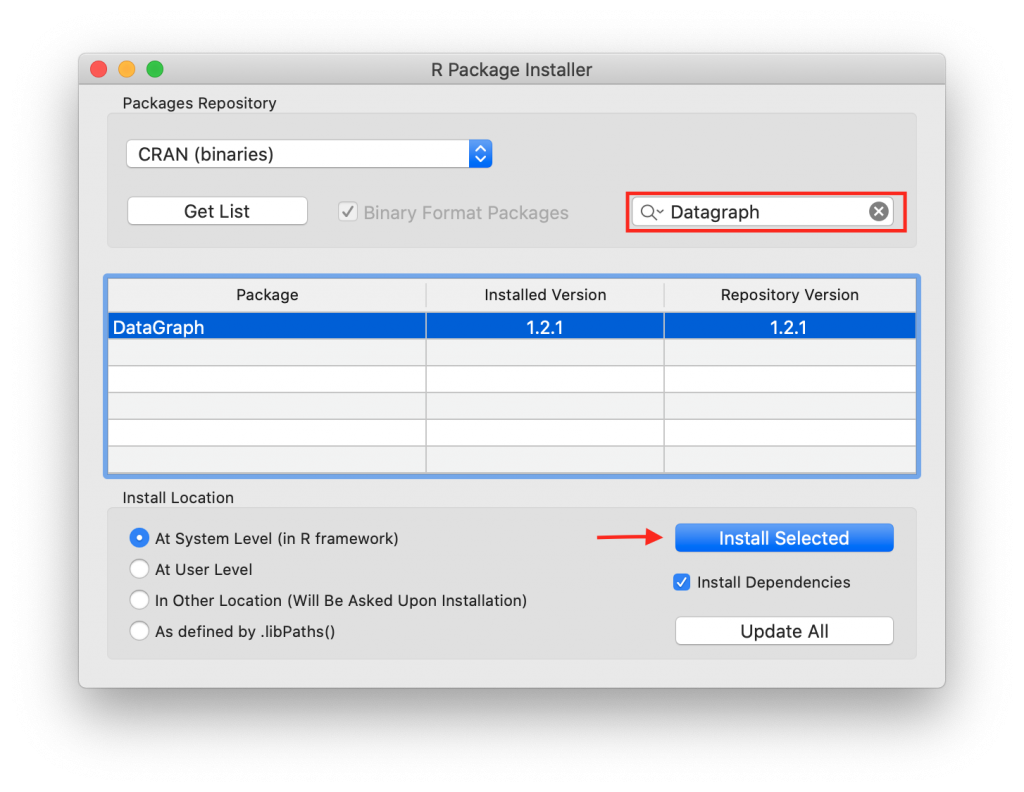
To install from the Package Installer, open the Package Installer in R (Packages & Data > Package Installer).
- Enter ‘DataGraph’ in the search menu. The latest version will be listed.
- Click to select DataGraph in the package list.
- Click the Install Dependancies check box.
- Click the Install Selected button.

Overview
The R language has several ways of saving data sets including: data frames, vectors, lists, and time-series. These data sets can include numeric data, text data, dates, and data labels.
The DataGraph package interprets the R data formats and maps them into DataGraph data types (numerical, text, dates).
There are three different uses for the package:
- To save a single R data set into a file (.dtable).
- To save a sequence of R data sets into a single file (.dtable).
- To save a collection of R data sets, either single data sets or sequences, into a file (*.dtbin).
Once you create a *.dtable or *.dtbin file, you can link those files to DataGraph and use the data in graphics or do further data processing. DataGraph monitors the linked dtable and dtbin files. If you update the data in these files, DataGraph will automatically reload the data and redo any graphics or function calculations. Typically the change will be reflected within a second of updating the file so you can effectively use DataGraph as part of your R programing flow.
R Datasets
R comes with a series of built-in datasets. To view a list of built-in R data sets type “data()” from the R console.
The example below use the “austres” data set, which contains a Quarterly Time Series of the Number of Australian Residents, from 1971 to 1993. This date set contains 89 entries in a time-series format. To view this or any dataset, type in the name from the R prompt.
> austres
           Qtr1    Qtr2    Qtr3    Qtr4
   1971         13067.3 13130.5 13198.4
   1972 13254.2 13303.7 13353.9 13409.3
   1973 13459.2 13504.5 13552.6 13614.3
   1974 13669.5 13722.6 13772.1 13832.0
   1975 13862.6 13893.0 13926.8 13968.9
   1976 14004.7 14033.1 14066.0 14110.1
   1977 14155.6 14192.2 14231.7 14281.5
   1978 14330.3 14359.3 14396.6 14430.8
   1979 14478.4 14515.7 14554.9 14602.5
   1980 14646.4 14695.4 14746.6 14807.4
   1981 14874.4 14923.3 14988.7 15054.1
   1982 15121.7 15184.2 15239.3 15288.9
   1983 15346.2 15393.5 15439.0 15483.5
   1984 15531.5 15579.4 15628.5 15677.3
   1985 15736.7 15788.3 15839.7 15900.6
   1986 15961.5 16018.3 16076.9 16139.0
   1987 16203.0 16263.3 16327.9 16398.9
   1988 16478.3 16538.2 16621.6 16697.0
   1989 16777.2 16833.1 16891.6 16956.8
   1990 17026.3 17085.4 17106.9 17169.4
   1991 17239.4 17292.0 17354.2 17414.2
   1992 17447.3 17482.6 17526.0 17568.7
   1993 17627.1 17661.5
 > plot(austres)
DataGraph Library
To run these examples, make sure to load the DataGraph library from the R command line.
library(DataGraph)
Example 1: Save a single R data set
Save from R
To save a single data frame, use one of the built in datasets.
writeDTable("/tmp/table",austres)
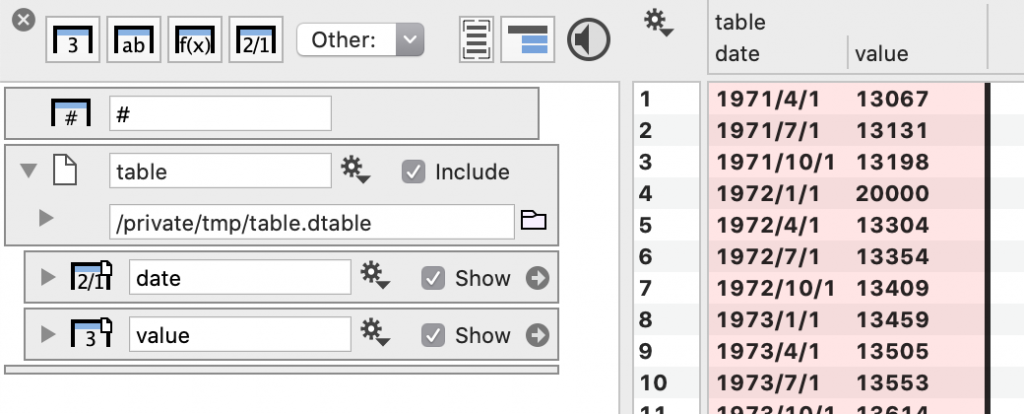
A file named ‘table.dtable’ is the location /tmp/. The data contained in “austres” is a time-series vector. The data gets automatically converted into a table with two columns, date and value. To add ‘table.dtable’ to your DataGraph file, you need to add an extra in your column definition list.
Connect file to DataGraph
Step 1: Drag and drop the file (*.dtable or *.dtbin) onto the column list or select Other > Data File and select from the finder.

Step 2: Select the ‘dtable’ file from your file manager (e.g., “table.dtable”). This creates a group called ‘table’ that contains two columns: ‘date’ and ‘value’.

The column named ‘date’ is formatted as a date column, so when you draw the data using a Plot command the axis will be set properly.

The data is not imported into DataGraph in the same way as, for example, a CSV file. Instead the data file is connected by using a link. If you save the DataGraph file and open it up again, the *.dtable file will be read again, using whatever values are there at that time. If the file no longer exists, the columns will be empty.
Update R Output
If you overwrite a *.dtable file with new data, that new data will be drawn instead. You can try this out by pasting the followings command in R:
austres[4] <- 20000
writeDTable("/tmp/table",austres)
The first command changes the 4th entry in the austres data set to the value 20,000. The second command re-writes the data to the ‘table.dtable’ file. DataGraph will automatically notice the change and reload the table.

Any graphs using the data will be automatically updated as well.

Return the data to the original value using the following commands.
austres[4] <- 13254.2
writeDTable("/tmp/table",austres)
Example 2: Save a sequence of data frames
The first example only saved a single table, and overwrote the previous content with the new content. You can however save a sequence of tables into a single table file. Using the austres data frame as an example, create a silly example that saves 6,000 tables into a single file. This is done by first opening the table with the openDTable function, adding a data frame by using the addDTable command and then finally close the table file with the closeDTable function.
 mydata <- austres
 openDTable("/tmp/table")
 addDTable("/tmp/table",mydata)
 for (incr in 1:6000) {
      mydata <- mydata+1
      addDTable("/tmp/table",mydata)
 }
 closeDTable("/tmp/table")
This saves the 6001 tables into the file and DataGraph doesn’t load the content until the table file has been closed. Then you can use the small time slider to scrub through the sequence of tables. Note that here time is really the sequence number 0,1,2,…,6000
It is possible to have DataGraph load the sequence in while R is still writing the file. In order to do that however you need to make it explicit with a call to syncDTable
mydata <- austres
openDTable("/tmp/mytable")
addDTable("/tmp/mytable",mydata)
for (incr in 1:6000) {
      mydata <- mydata+1
      addDTable("/tmp/mytable",mydata)
      syncDTable("/tmp/mytable")
}
closeDTable("/tmp/mytable")
DataGraph will read this in in chunks, since the file system will cache the file and write it in blocks. But typically your execution will take a longer time and the effect will be more continuous. The file refresh is around one per second.
Example 3: Save a collection of data frames
The previous two examples saved a single frame to a file. You can however same multiple data frames to the same disk, and each one can be a sequence. The main requirement is that the names have to be unique and each frame with the same name has to have the same structure, e.g. number and name of columns. As an example, let’s save a single frame of the women sample data file and the same sequence as before of austres
openDTBin("/tmp/combined")
addDTBin("/tmp/combined","women",women)
mydata <- austres
addDTBin("/tmp/combined","austres data",mydata)
for (incr in 1:6000) {
      mydata <- mydata+1
      addDTBin("/tmp/combined","austres data",mydata)
      syncDTBin("/tmp/combined")
}
closeDTBin("/tmp/combined")