-
Getting Started
-
User Interface
-
Input
-
Data Types
-
Data Actions
-
Data Exploration
-
Calculations
-
Graph Settings
-
Common Elements
-
Core Graphing
-
Annotating
-
Data Analysis
-
Functions & Fitting
-
Staying Organized
-
Exporting
-
Scripting
-
Beta
-
Join the Community
-
Under Review
- Articles coming soon
How to embed a DataGraph image in a document
Easily embed or insert images that you create in DataGraph into other files, such as word processors.

Copy and Paste
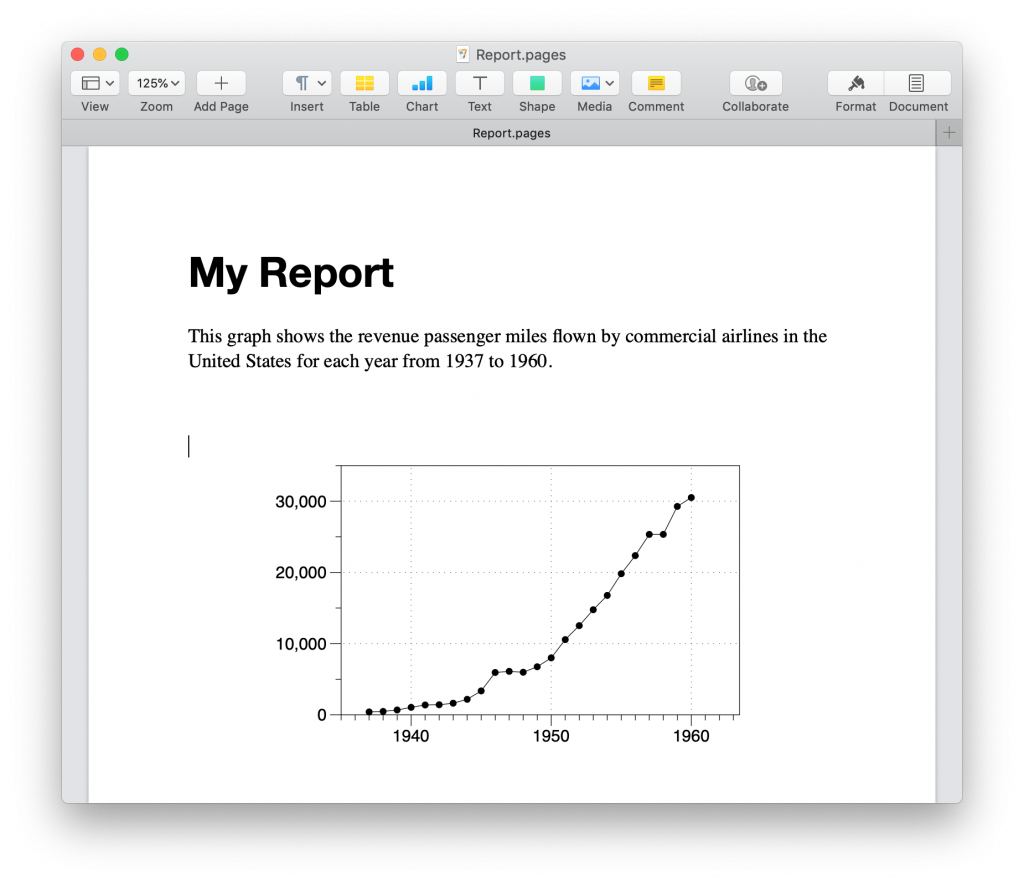
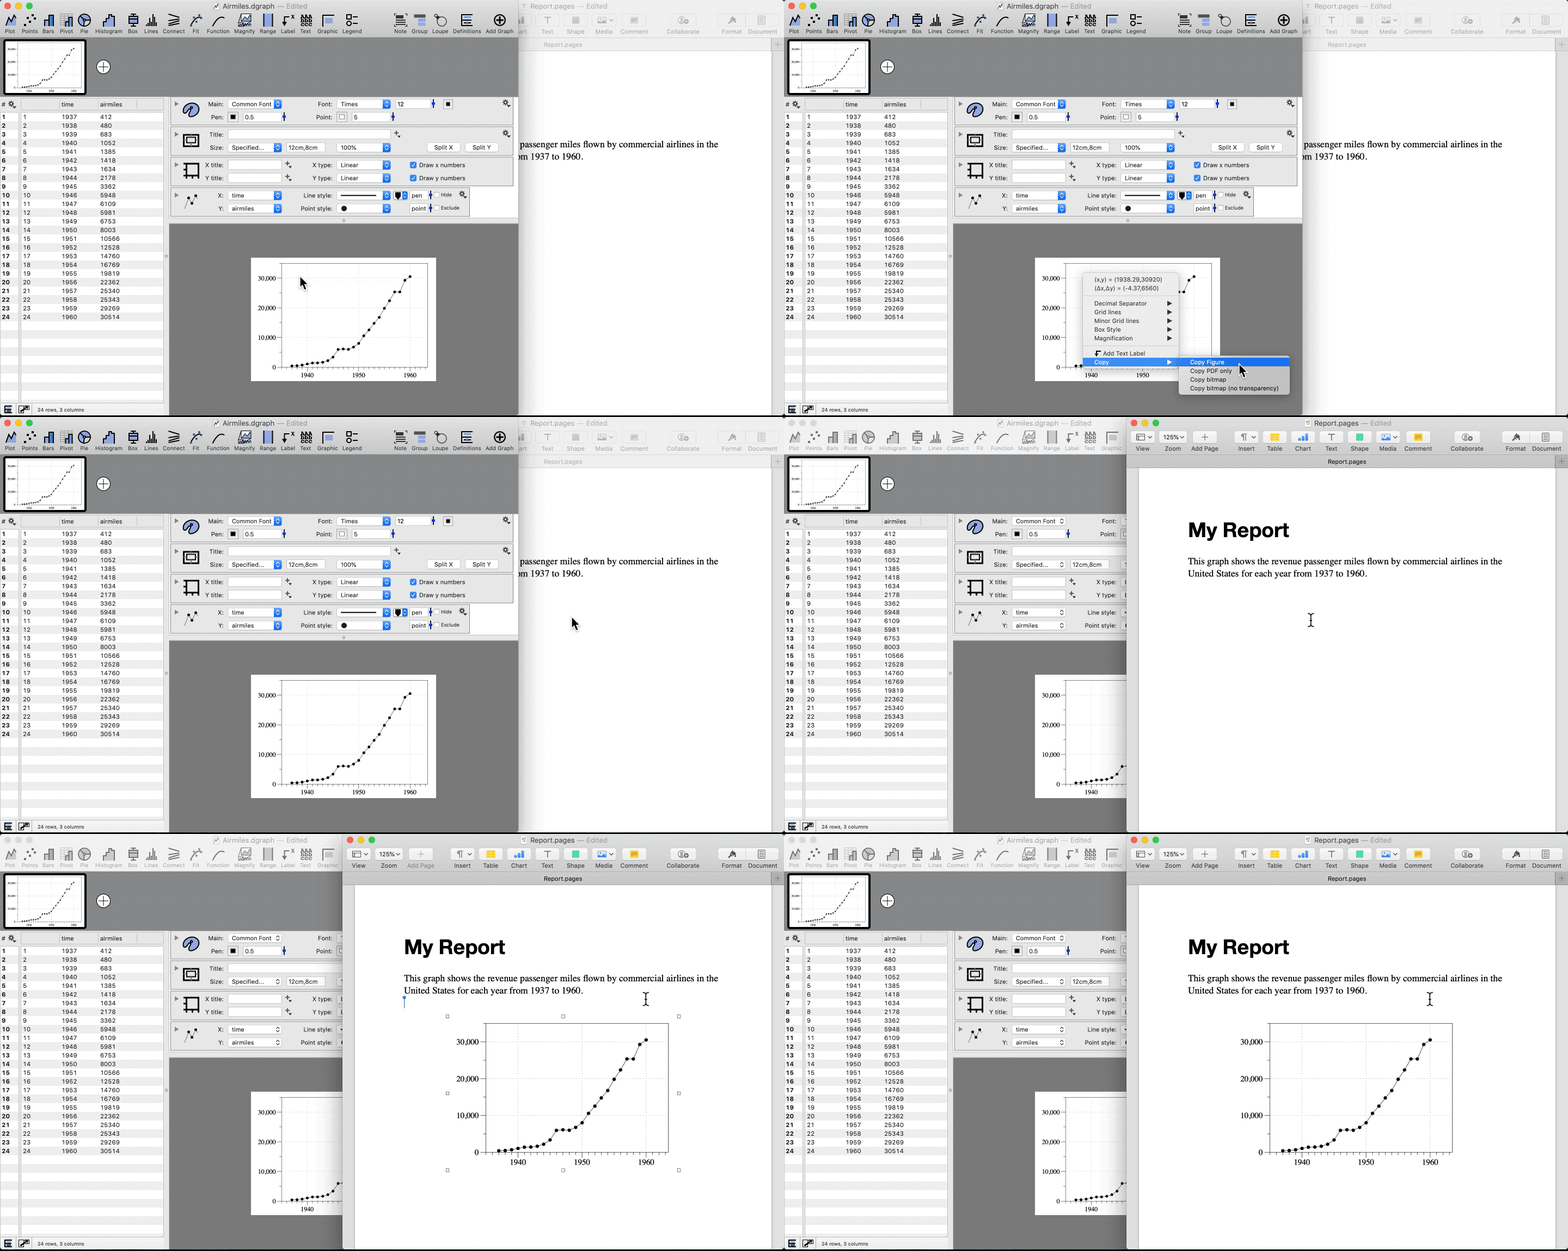
Select Copy Figure from the Edit menu.

Or Copy the image directly from the canvas.
- Control-click on the image
- Select Copy Figure
- Click in your document
- Command-V to paste

Things to keep in mind …
Image quality
To get the best image quality, it is important to set the size you want in DataGraph, rather than resize the image after you export.

Learn more about setting the size of your graph in the Canvas settings documentation.
Image type
When you copy a DataGraph file image into the clipboard, there are two representations saved:
- a vector graphic (e.g., pdf)
- a bitmap image (e.g., jpeg)
It is up to the program you are pasting into to select the appropriate type. Word processors will typically pick the pdf image format, which gives the best image quality.
Image background
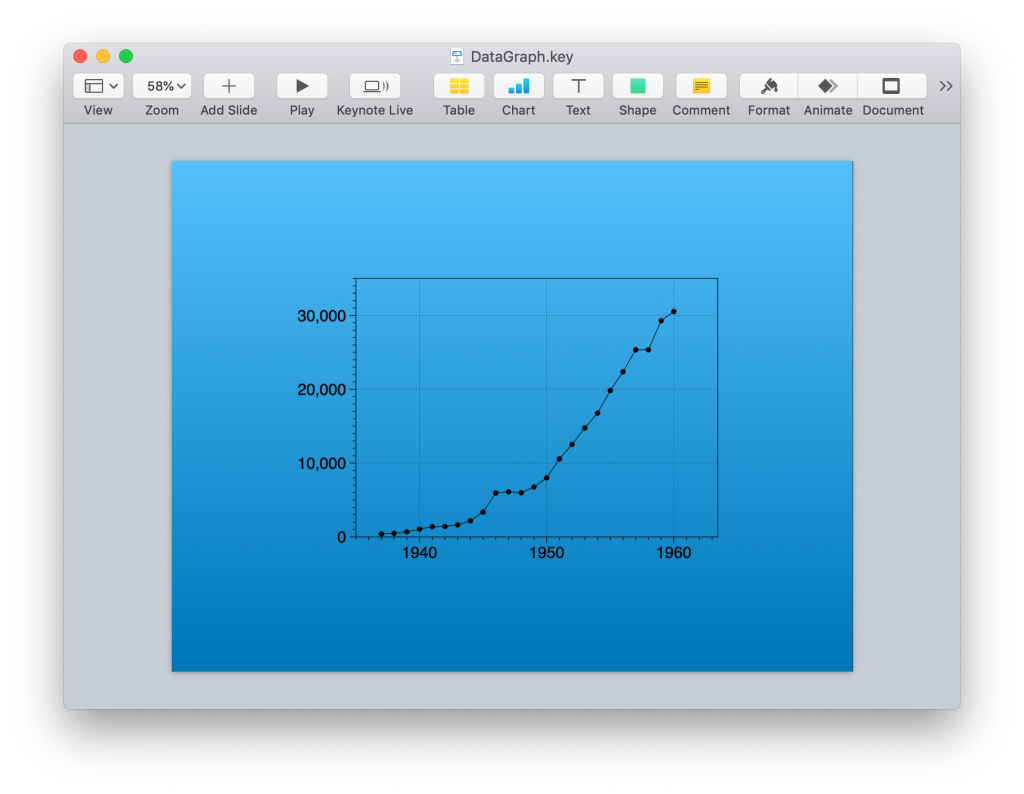
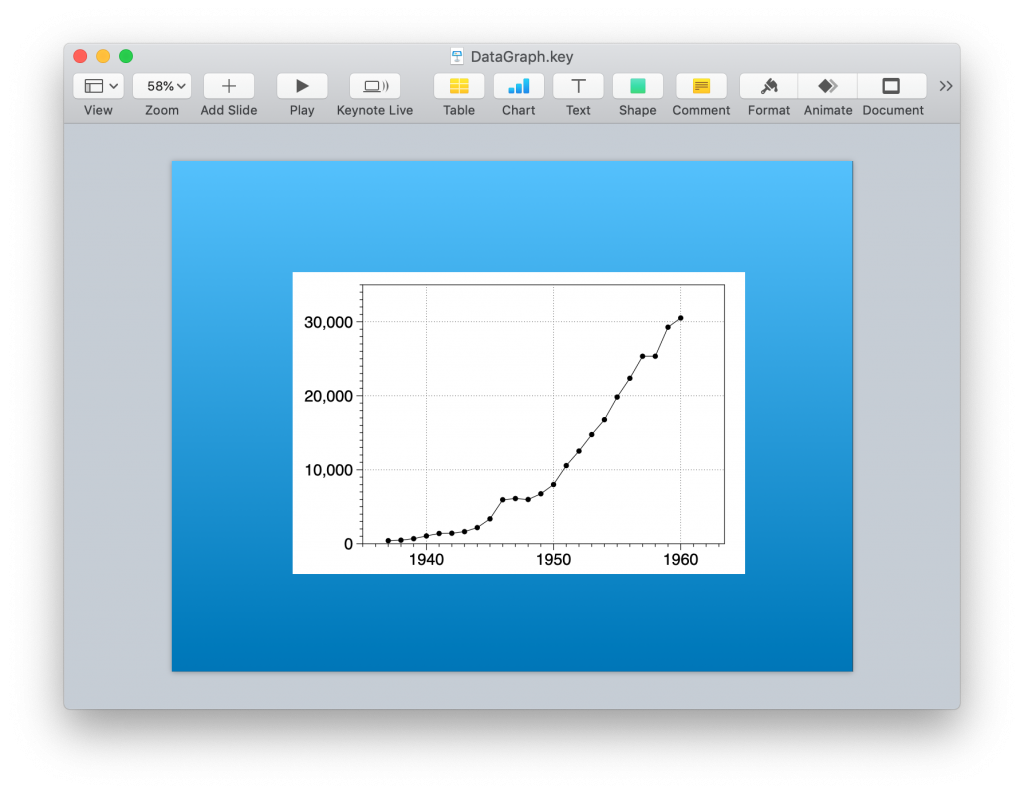
If you paste an image into a document with a background color, such as a presentation slide, the image will allow the color to show through.

By Default, DataGraph images do not include any background color and are transparent (i.e., contain an alpha channel).

To learn more about setting a background color, see the Canvas settings documentation.
NOTE: To click and drag an image after it is pasted, click on a part of the image that contains text or lines.