-
Getting Started
-
User Interface
-
Input
-
Data Types
-
Data Actions
-
Data Exploration
-
Calculations
-
Graph Settings
-
Common Elements
-
Core Graphing
-
Annotating
-
Data Analysis
-
Functions & Fitting
-
Staying Organized
-
Exporting
-
Scripting
-
Beta
-
Join the Community
-
Under Review
- Articles coming soon
How to Edit Axis Titles
Axis titles are used to label the x-axis or y-axis. You can edit axis titles in DataGraph directly on the graph or using the Axis settings.
Add Axis Titles
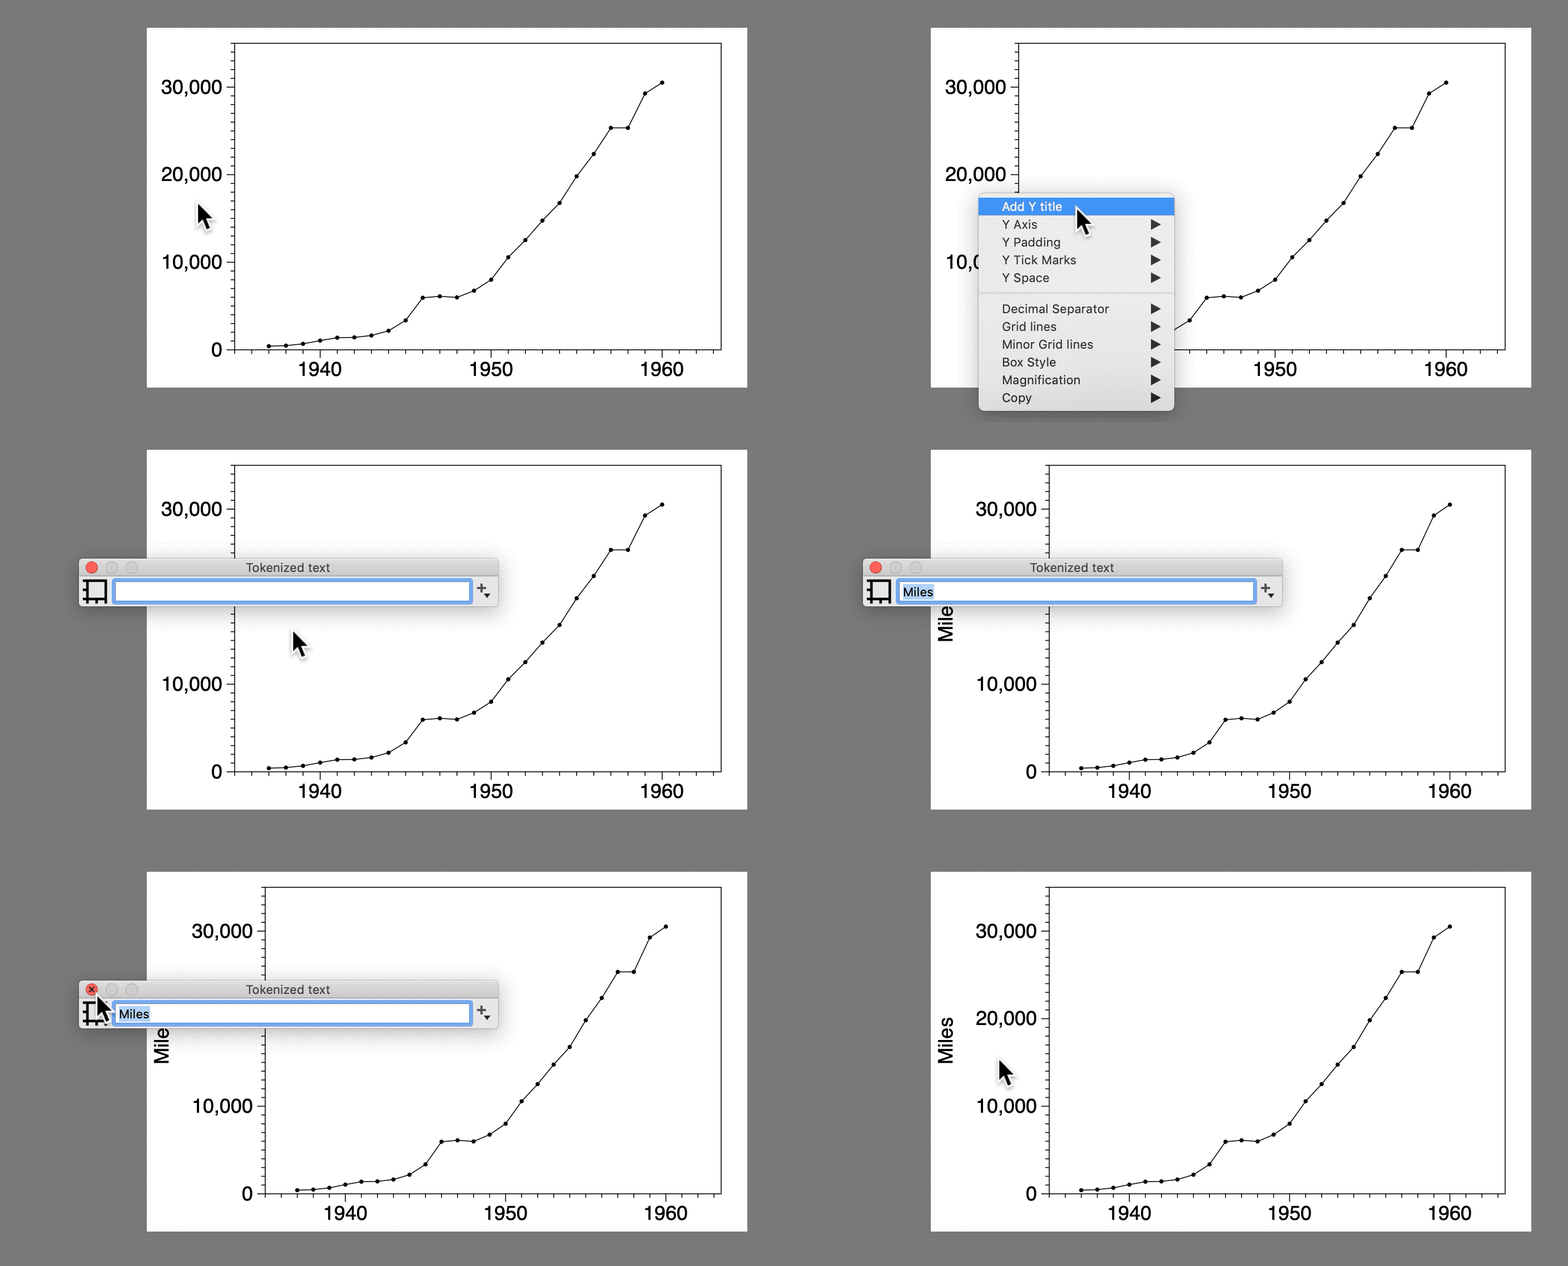
To add new titles directly on the graph:
- Control-click (right-click) left or below the axis tick-marks.
- Select ‘Add Y Title’ or ‘Add X Title’.
- Enter the title in the pop-up text box.

The axis titles are saved in the Axis settings. You can also enter the titles directly in the Axis settings.

Edit Axis Titles
To edit, double-click on the axis label directly on the graph OR edit in the Axis settings.
Using Tokens
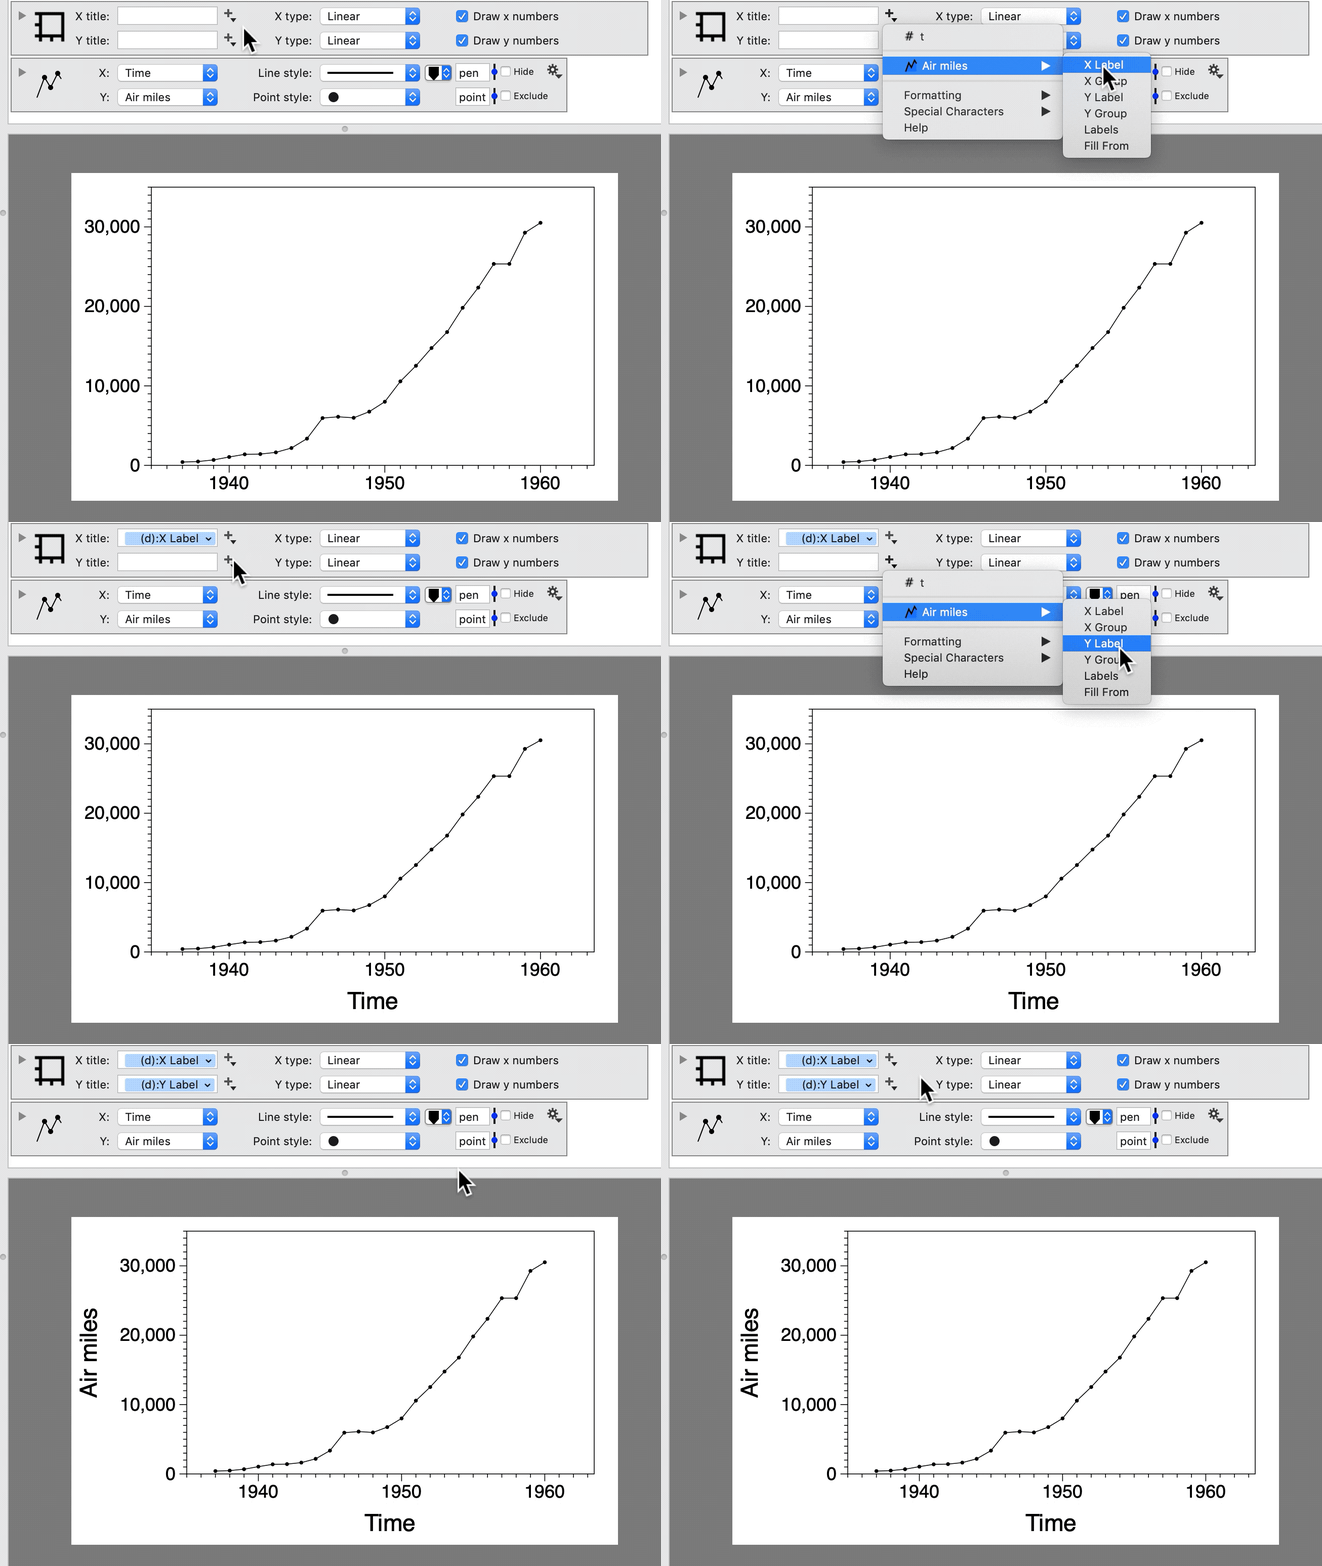
A token is a dynamic link that displays the name of the data column (X label or Y label) selected in a command.

To add a token (dynamic link):
- Click the small + menu to the right of the text field.
- Navigate to the list of available commands.
- Select an item to create a link.
In the example below, the axis labels are linked to the name of the x and y columns used in the Plot command. If the column names are changed, the axis labels will also change.

Wrap Titles
There are two ways to extend axis titles across multiple lines (i.e., to wrap text).
- Enter in the Axis settings using ‘\n’ separator.


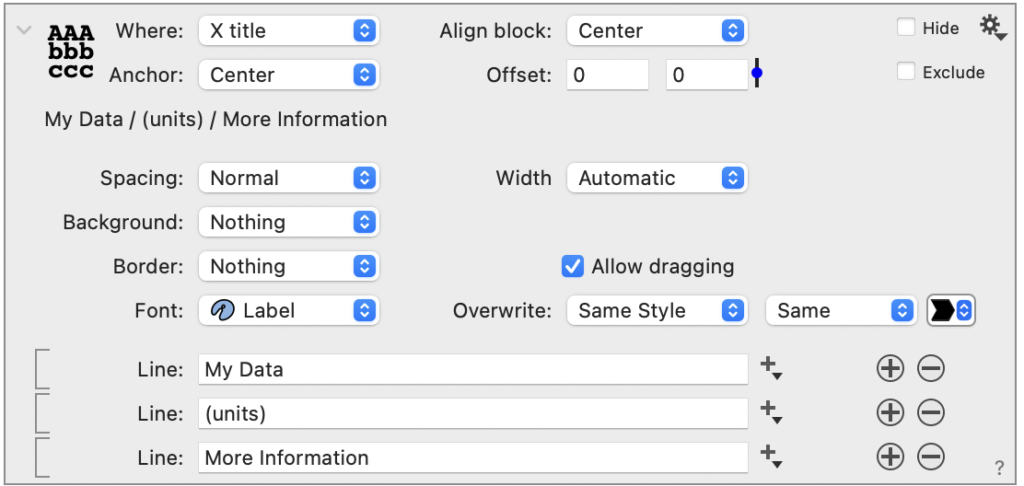
- Enter using a Text command with multiple lines (Where = ‘X title’).


Align Titles
The X title in the Axis settings is aligned in the bottom center of the graph. To have more customization options, use a Text command with Where = ‘X title’.
In this example, Anchor and Align Block are both set to ‘Left’.

