DataGraph Reference Manual
-
Getting Started
-
User Interface
-
Input
-
Data Types
-
Data Actions
-
Data Exploration
-
Calculations
-
Graph Settings
-
Common Elements
-
Core Graphing
-
Annotating
-
Data Analysis
-
Functions & Fitting
-
Staying Organized
-
Exporting
-
Scripting
-
Beta
-
Join the Community
-
Under Review
- Articles coming soon
Print
How to Combine Graphs
UpdatedDecember 1, 2024
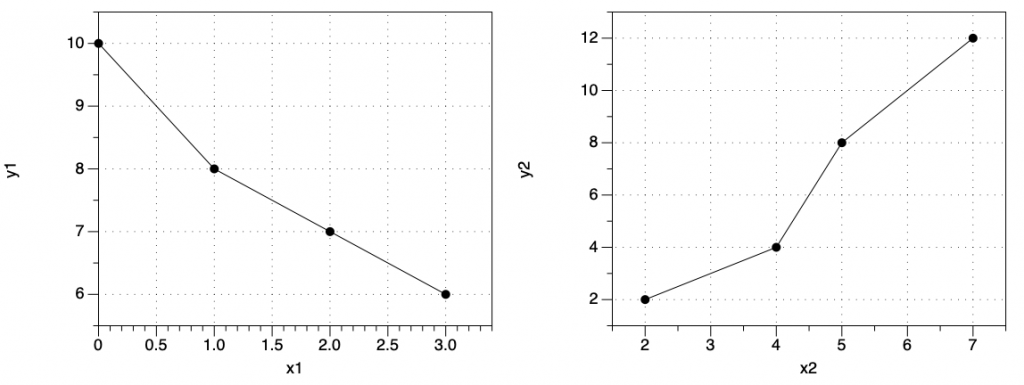
You can combine or composite multiple graphs using a Graphic command. This command will add an existing graph as an image. You can also use the Graphic command for adding external images.

NOTE: If your graphs share the same axis, try using a Split axis.
Select Graphs
To combine two graphs.
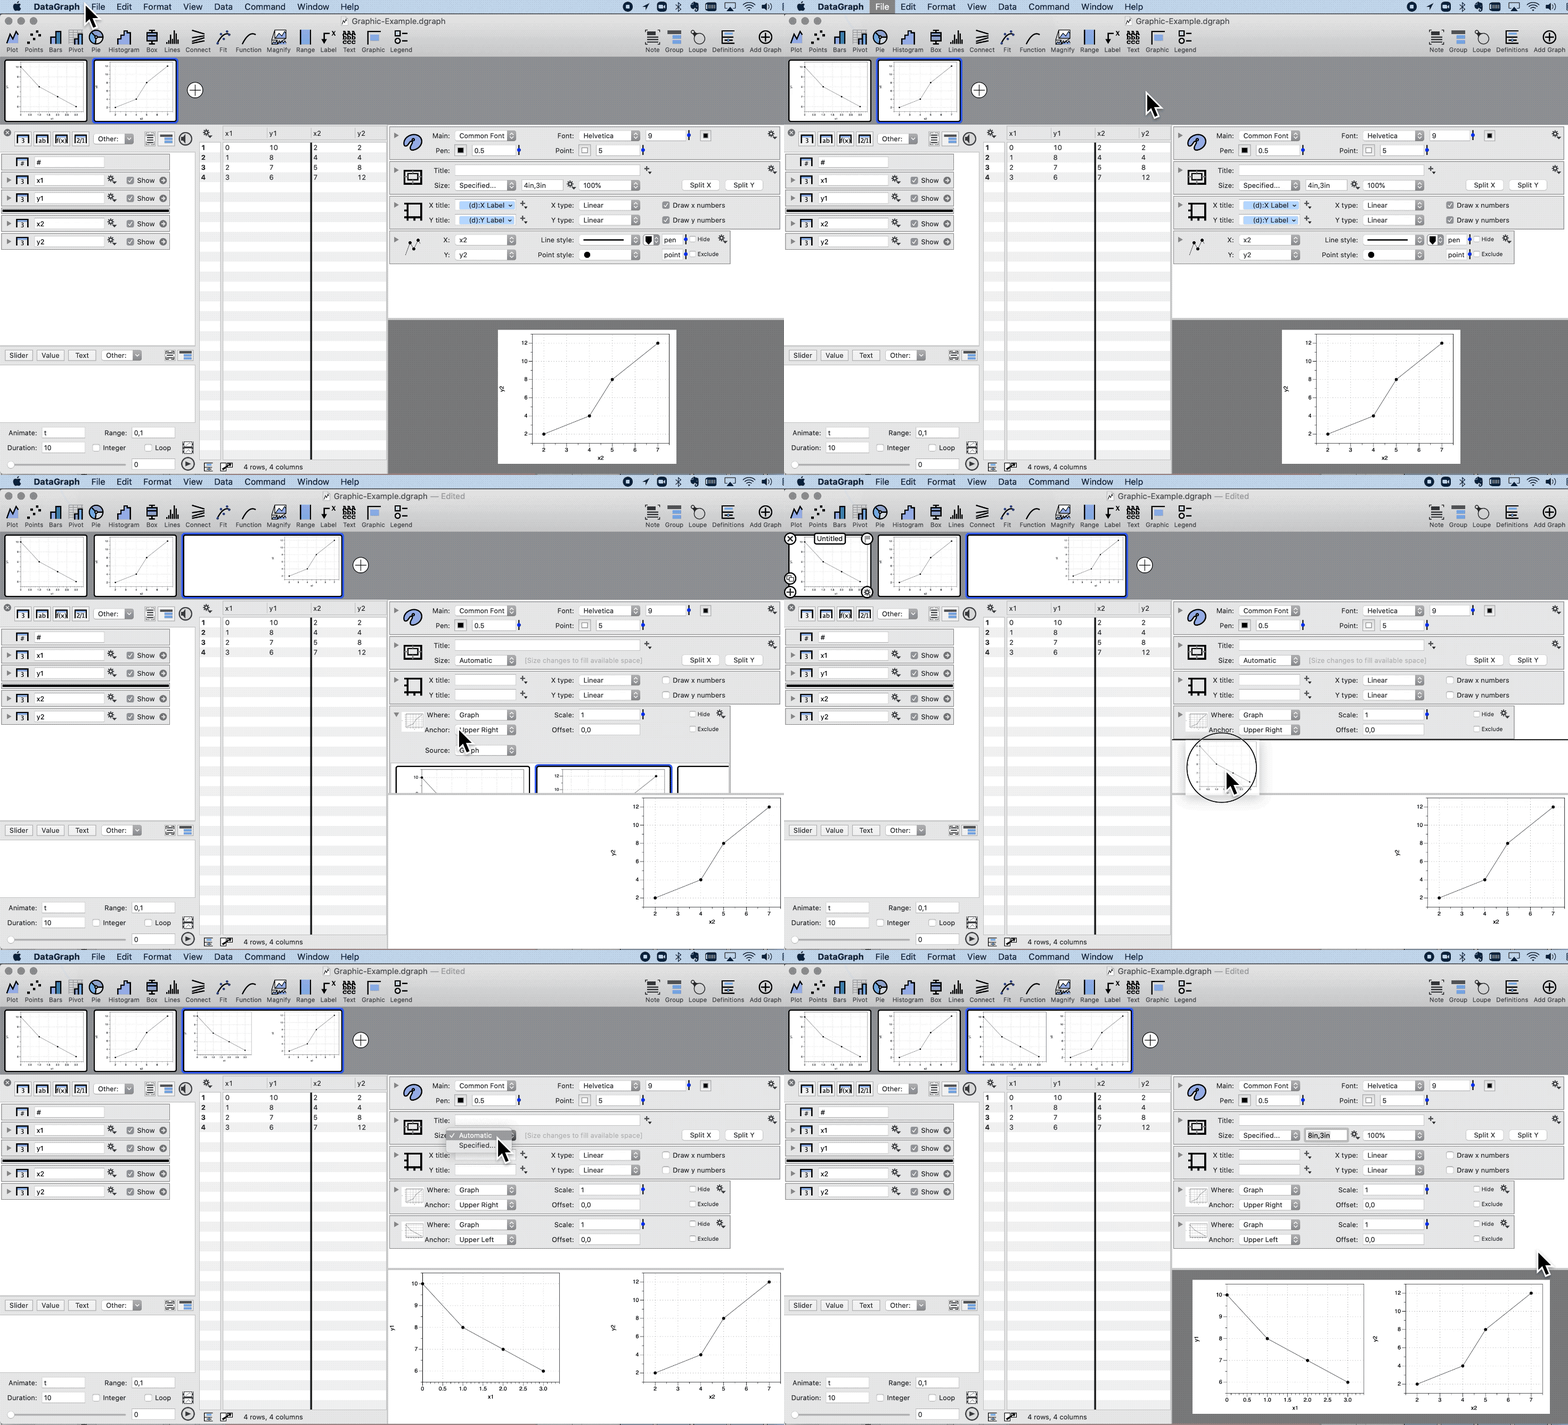
- Select File > New Graph > For composition. This creates a new blank graph.
- Select Command > Add Graphic (at the bottom of the menu).
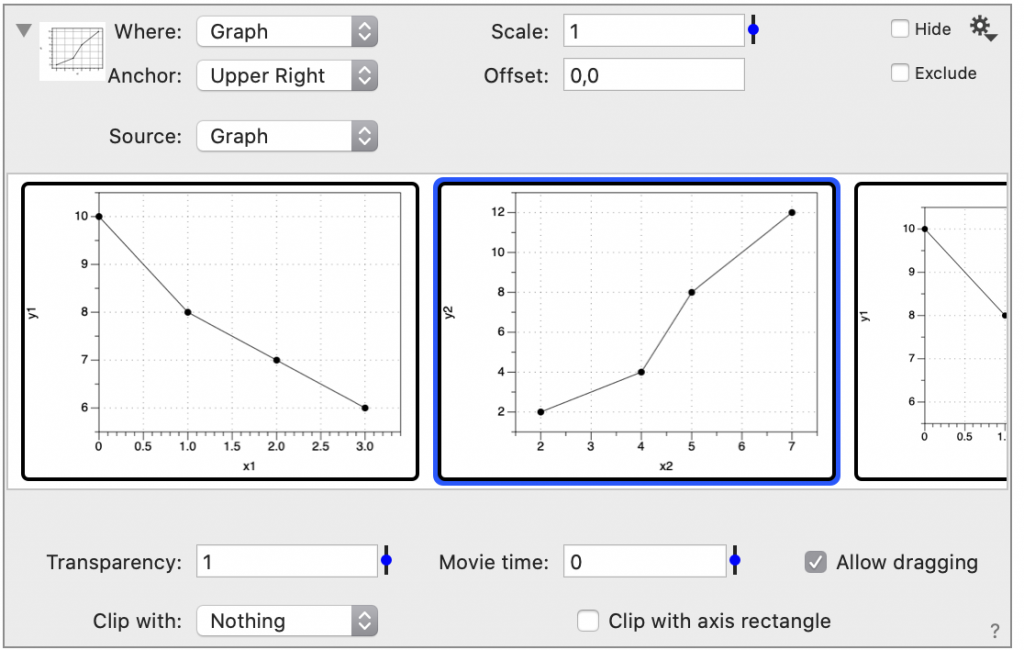
- In the command, set Source to ‘Graph’.
- Choose an existing graphs from the thumbnails.
- Repeat twice (2-4) for a second graph.

Use the Anchor setting to align the graphs on the Graphic command.

Use the Offset to specify a distance from the Anchor location, where the Offset can be in pixels or in distance units (i.e., 2cm,2cm).
Use Drag and Drop
You can also drag the thumbnails onto a Graphic command to quickly select the graph. Or Drag the thumbnails onto the command list to create a Graphic command using that image.
Both approaches are illustrated below.

Updated
On This Page