DataGraph Reference Manual
-
Getting Started
-
User Interface
-
Input
-
Data Types
-
Data Actions
-
Data Exploration
-
Calculations
-
Graph Settings
-
Common Elements
-
Core Graphing
-
Annotating
-
Data Analysis
-
Functions & Fitting
-
Staying Organized
-
Exporting
-
Scripting
-
Beta
-
Join the Community
-
Under Review
- Articles coming soon
Print
How to Edit Grid Lines
UpdatedDecember 1, 2024
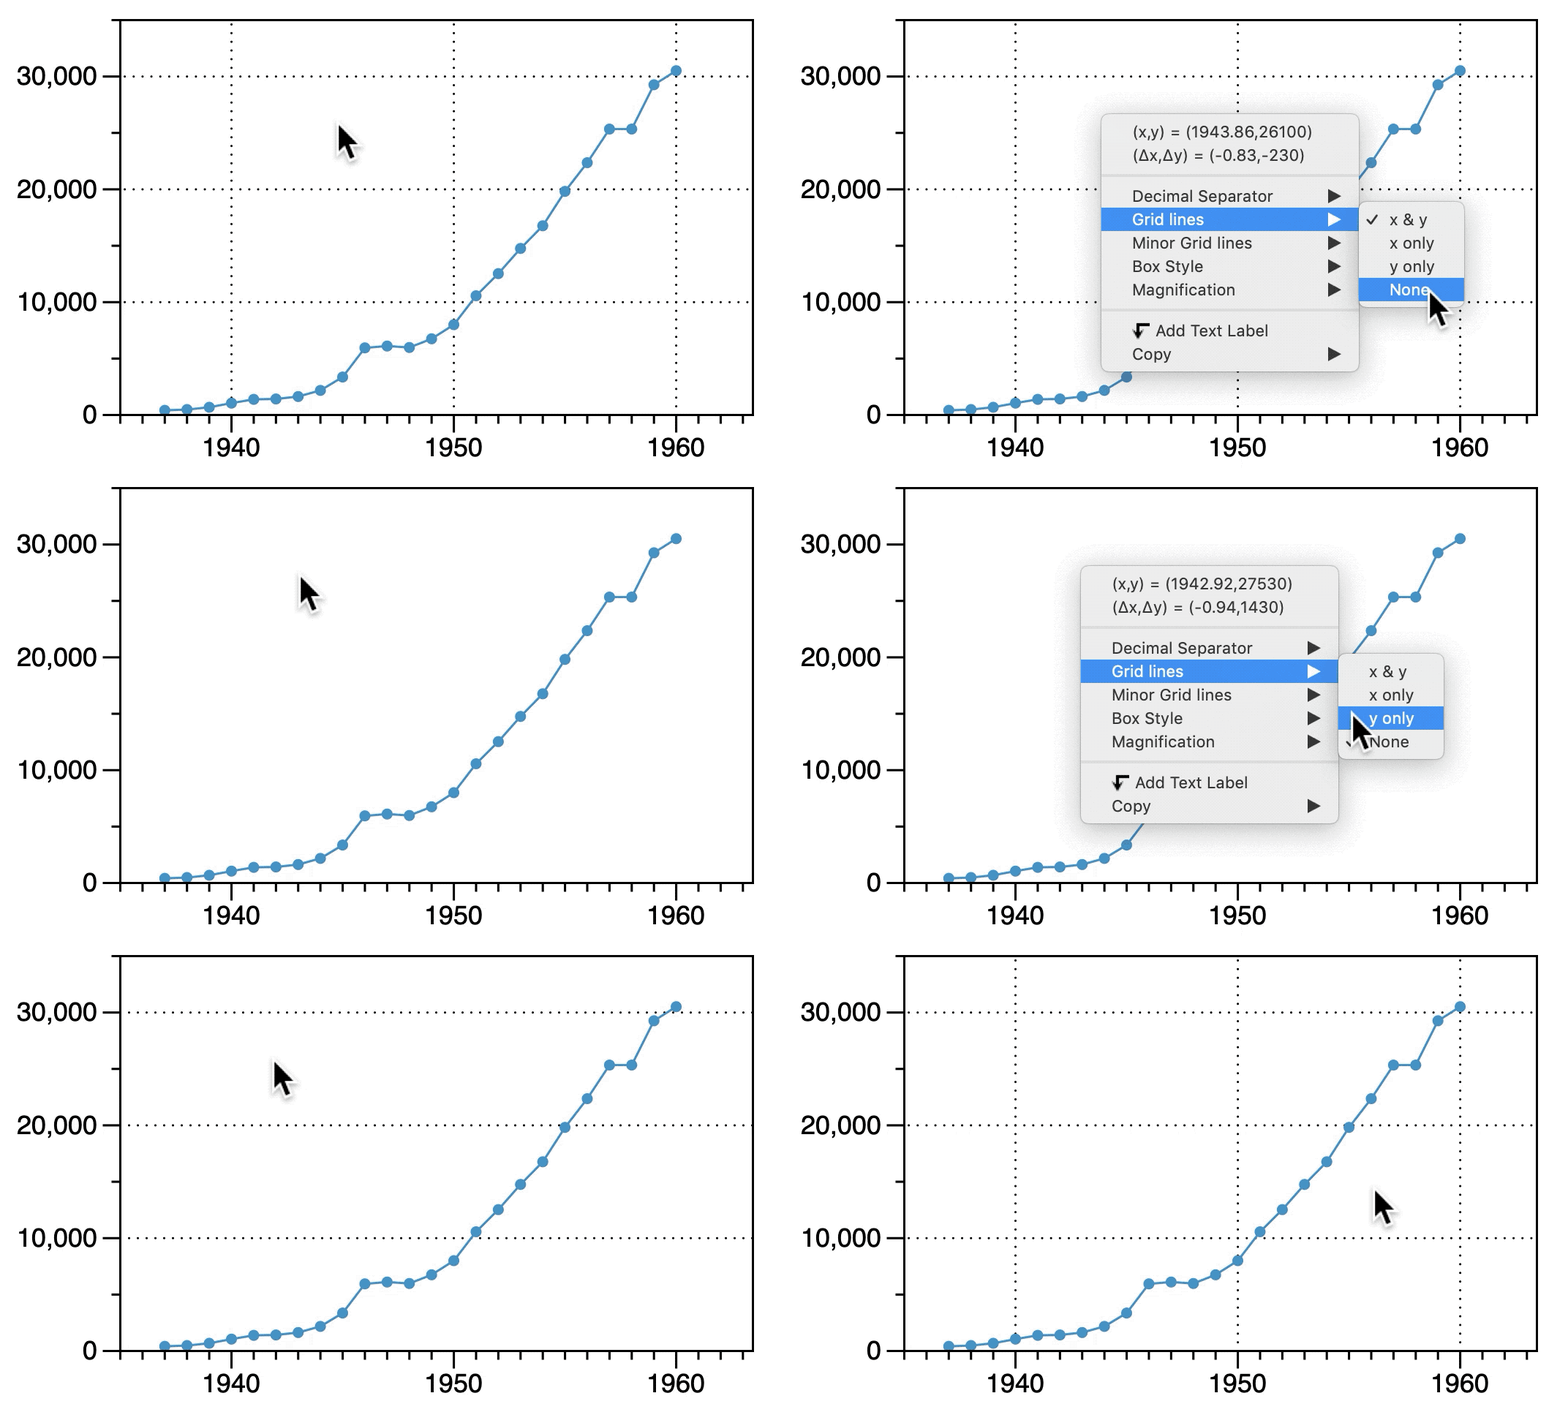
By default, new graphs contain grid lines on the major tick marks.
You can quickly remove or add major and minor grid lines:
- Step 1: Control-click on the graph
- Step 2: Select the type of grid lines / minor grid lines

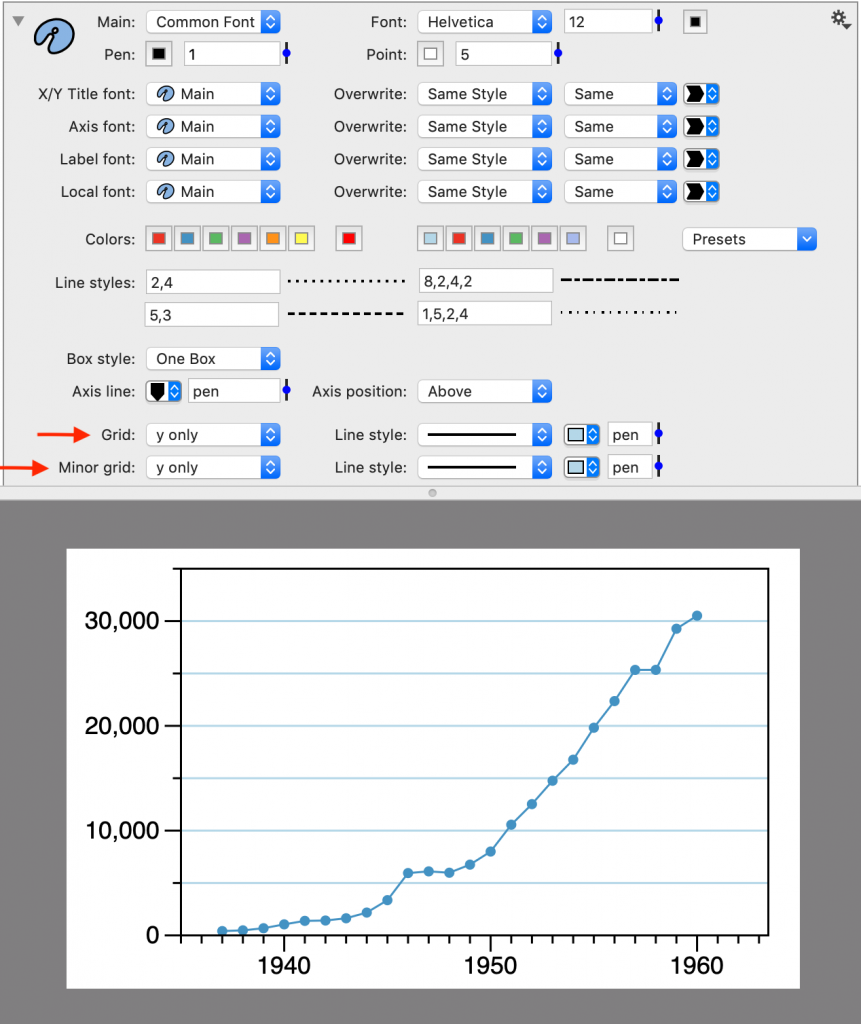
The grid lines settings are stored in the Style settings. There you can further customize the line styles and colors for the major/minor grids.

On This Page