-
Getting Started
-
User Interface
-
Input
-
Data Types
-
Data Actions
-
Data Exploration
-
Calculations
-
Graph Settings
-
Common Elements
-
Core Graphing
-
Annotating
-
Data Analysis
-
Functions & Fitting
-
Staying Organized
-
Exporting
-
Scripting
-
Beta
-
Join the Community
How to Set the Graph Size
The graph size can be specified to an exact value in the Canvas settings.

Specify the Size
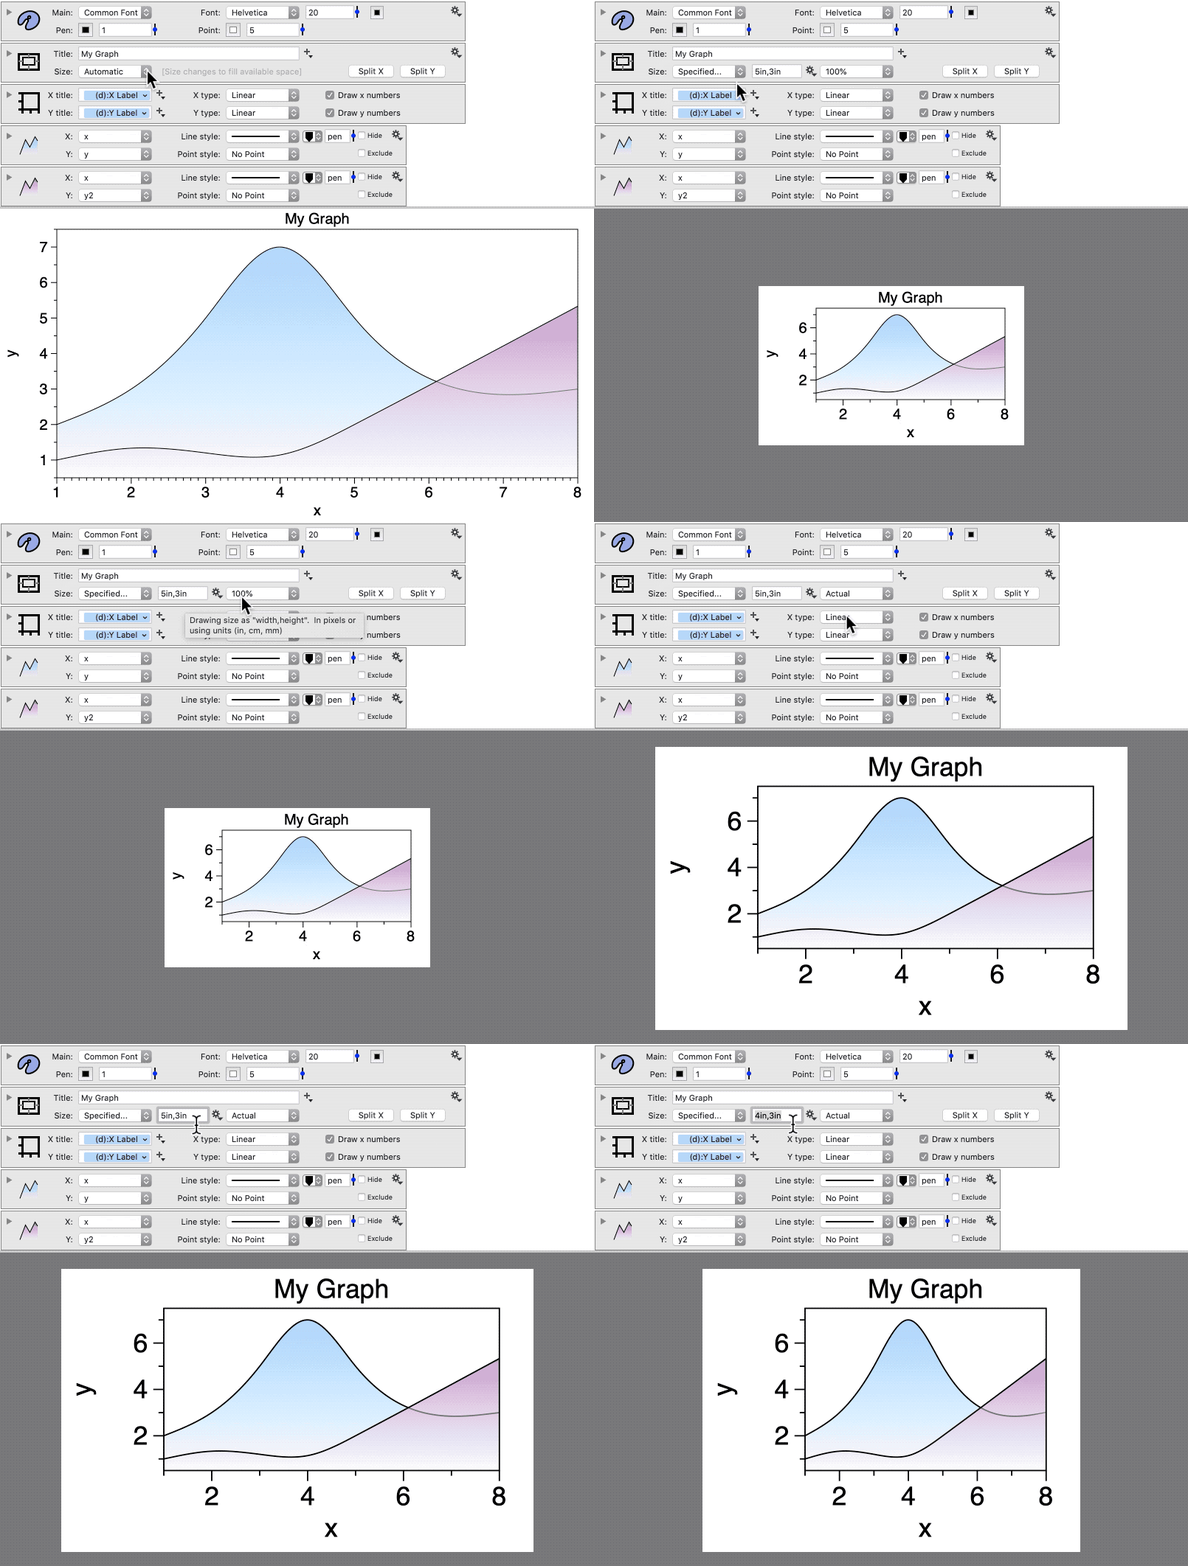
STEP 1: Change the Size menu to ‘Specified’.
This will snap the size of the graph and reveal an entry box and a menu. The entry box contains the width, height. The menu to the right changes the magnification of the graph on the screen.
STEP 2: Edit/Enter the size you want (width, height) using units of measure (in, cm, mm) or pixels.

STEP 3: (OPTIONAL) Change the menu to ‘Actual’.
This is an optional step but can be very useful when creating graphs for publication, as the size on the screen will correspond to the size you entered.
Set the Size to Pixels
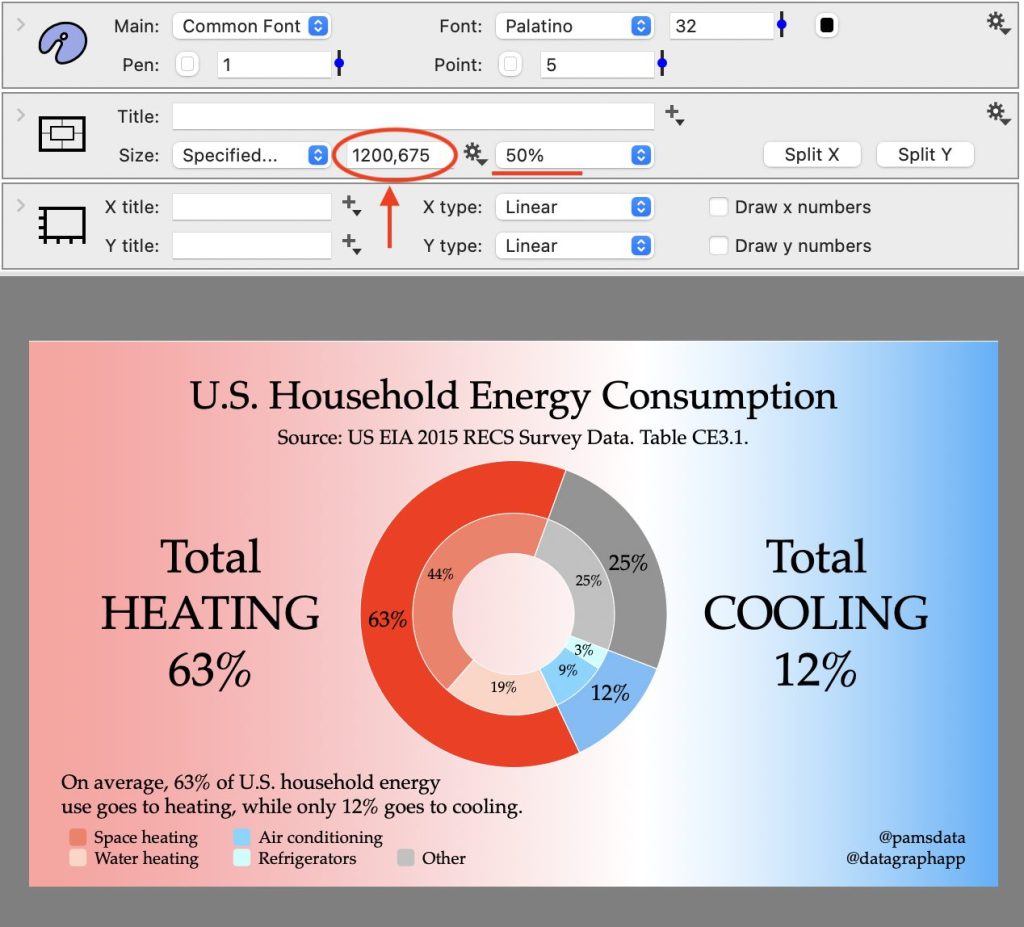
To set the exact pixel size for the output, enter the width and height separated by a comma.

When exporting the image, setting the dpi to the standard resolution of 72 will result in an image that is exactly the pixel size specified in the Canvas settings.
Learn more about Exporting Images.
Create a Custom Size List
Use the gear menu to create your custom list of sizes.
STEP 1: Enter the size you want, as noted above.
STEP 2: Click to gear menu and select ‘Add sizes to menu’.

STEP 3: Click the gear menu again and you will see a list of sizes to select from.

You can also remove sizes from the list. First, type the size in the entry box. Next, click the gear menu, and you will see the option to ‘Remove size from gear menu’.
NOTE: The custom size list will be available in every DataGraph file you create.