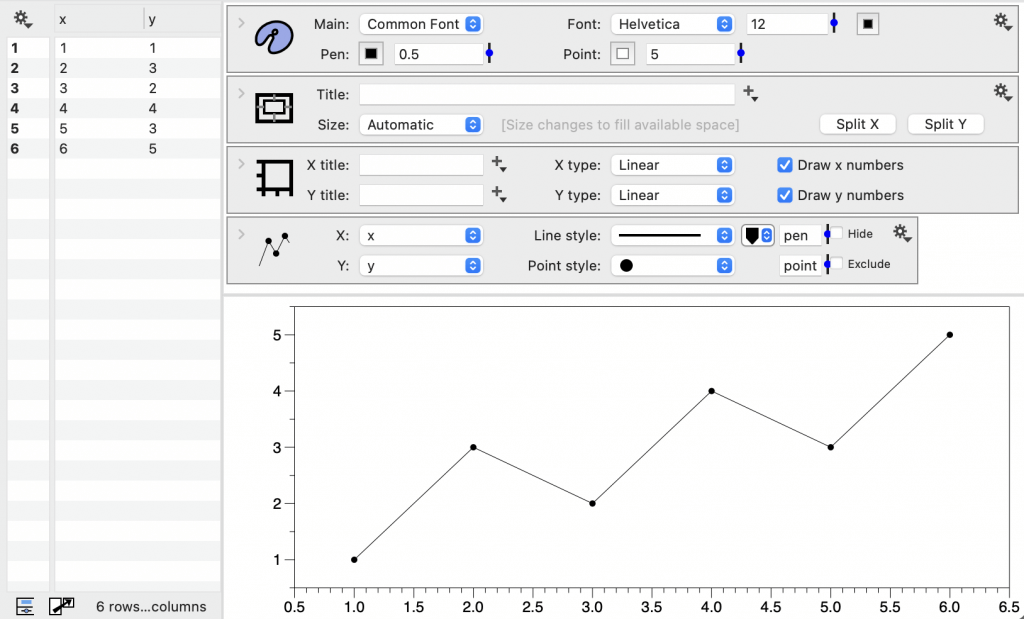
Canvas settings
The Canvas settings contain options for customizing the drawing area and the graph title. This includes setting the size, background colors, and margins.

Size
By default the graph size is set to ‘Automatic’, meanging that the size is fills the area included by the sliding bars.


It is better to set the size of the graph to the final size in DataGraph rather than scale the figure in another program (e.g., word processor).
Change the Size menu to ‘Specified’ and you can enter the exact size in units of measure: inches (in), centimeters (cm) or millimeters (mm).

The size can also be specified in pixels.

If the scaling to the right of the size is set to ‘Actual’, the size on the screen will correspond to the scale specified (e.g., 5in by 3in).
Once you select the size you can set the working magnification. This does not affect the output but makes it easier to work on small graphs or on machines that have very high resolution.
The Actual setting in the magnification menu makes the graph appear at the same size as when you print it. Otherwise a graph will look a lot smaller on the screen than when you include it in a text document.
Title font
Customize the title font, color and, position.

Background
Customize the fill for the overall background, the axis background and the foreground.


NOTE: If you don’t want the background color exported, uncheck the Export box to the right of the Background menu.
Margins
Specify the margins between the axis and the edge of the graphic.
If you leave them blank, DataGraph uses automatic rules to determine the space around the axis. This space depends on the title, font, setting in the axis, what drawing commands want to draw outside the data area, etc.

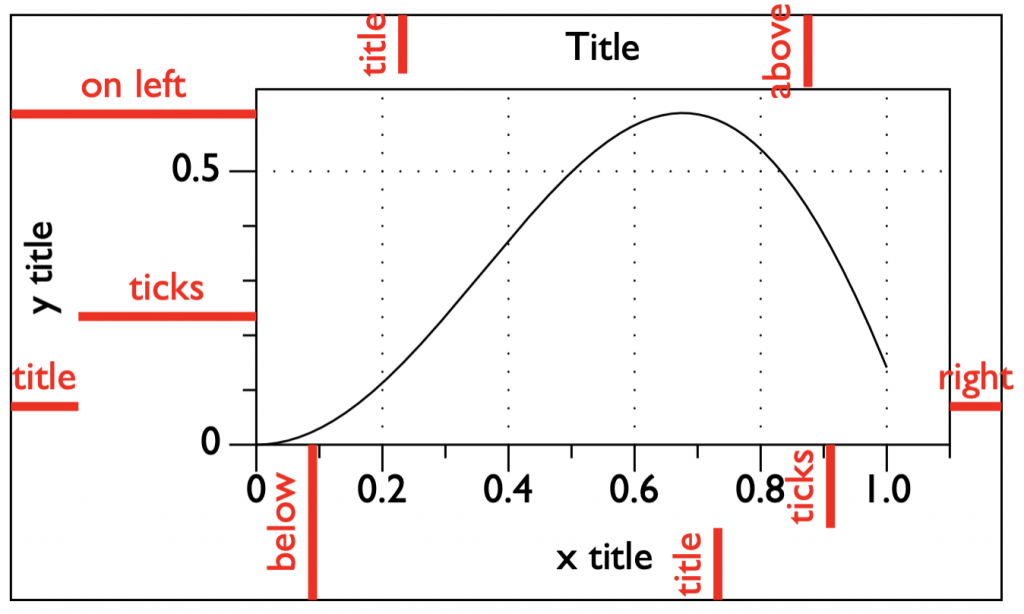
The following figure shows how the margins are computed.

If you leave the margins as automatic in the canvas, the margin is the sum of the tick mark space and title space. Otherwise the margin space is exactly what you specified, but this will not affect the tick or title space.
Note that the margins are set in pixels, but DataGraph has defined conversion constants so that you can type in ‘1.1in’ and it gets converted to pixels. Note that the tick spacing is adjusted in the axis settings. The title space depends on what is drawn there and is not set directly. If you want to tweak it, you do that by setting the corresponding margin.