DataGraph Reference Manual
-
Getting Started
-
User Interface
-
Input
-
Data Types
-
Data Actions
-
Data Exploration
-
Calculations
-
Graph Settings
-
Common Elements
-
Core Graphing
-
Annotating
-
Data Analysis
-
Functions & Fitting
-
Staying Organized
-
Exporting
-
Scripting
-
Beta
-
Join the Community
Print
Stocks
Updated
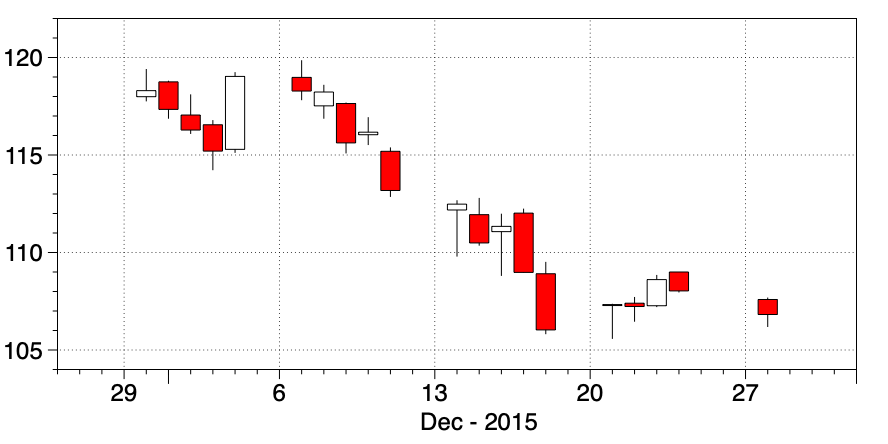
The Stocks command can be used to visualize stocks using two different styles, Candlestick and OHLC (open high, low close). For more information on Candlestick charts see Wikipedia.
Input
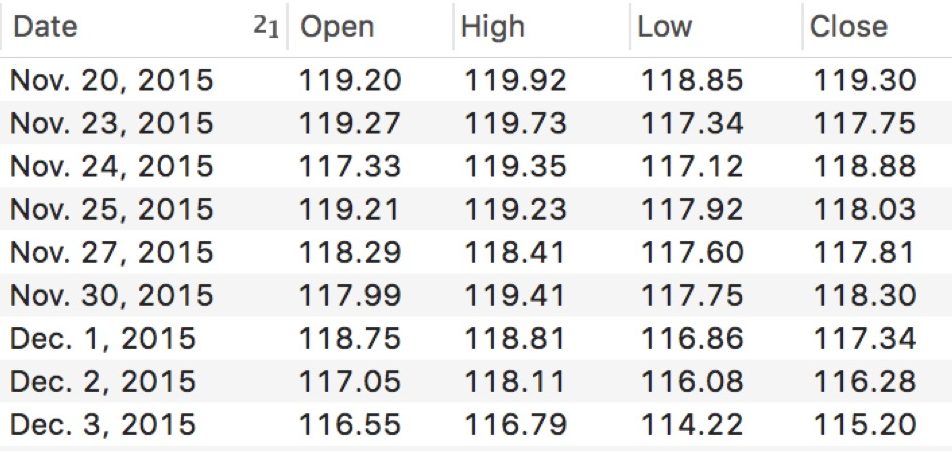
To use this command, you will need to have columns in the data table corresponding to the open, high, low and close, as shown in the example table below.
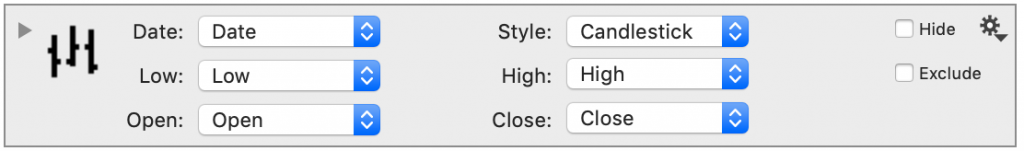
Style
The Style can be modified from Candlestick to OHLC (open high, low close).
Line and Fill
The Line style changes the color of the outline.
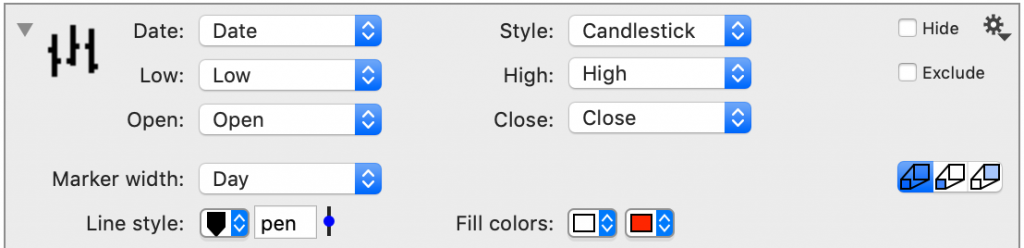
The Fill colors have two tiles that the color when the stocks increase or decrease.
Mask
To apply a Mask use the date format, year:month:day.

Updated
On This Page