Organizing Graphs
The purpose of the grouping functionality is to help organize files where you have multiple graphs or graphs of different types that you would like keep together.
Key Features:
- Collapse graph thumbnails into one group
- Drag and Drop thumbnails into groups
- Nest groups within other groups
Create the Group
Hover the cursor over a thumbnail and click the gear button at the bottom left corner. Select ‘Create a graph group’.

A group object is added to the left of the thumbnail.
Name the Group
Click in the middle of the group object to add a name.

Notice the horizontal bar to the right of the thumbnail. This bar indicates the end of the group.
Add Graphs
Click and drag graph thumbnails into the group. Click the icon in the top left corner to collapse the group.
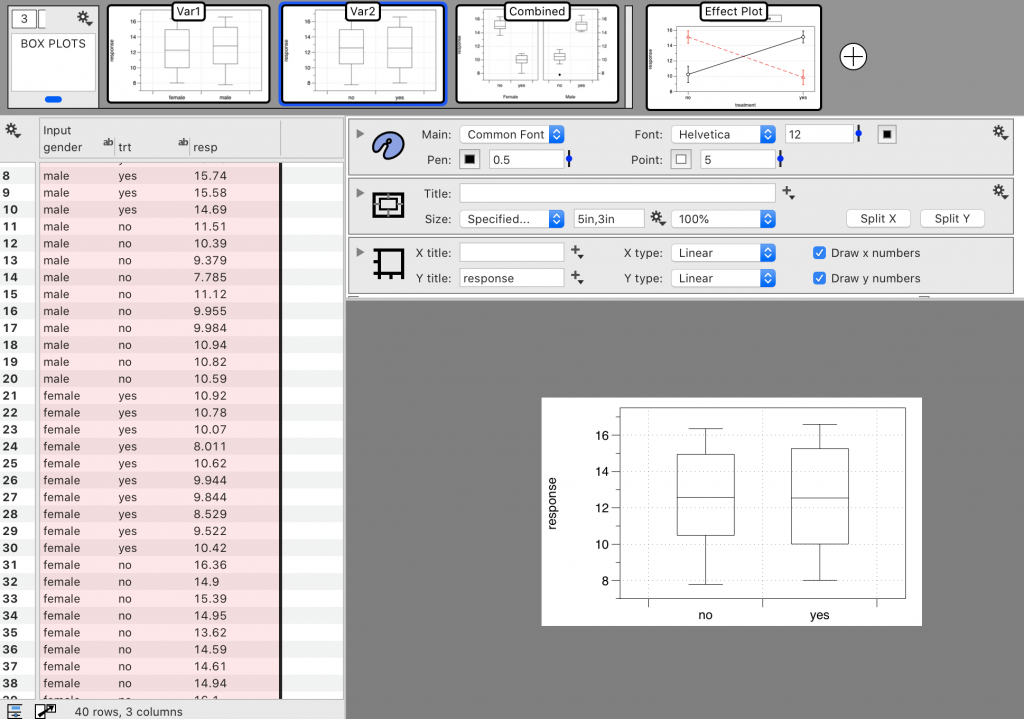
When you add graphs, there is a counter on the top left corner that shows the total number of graphs in the group. Here the group ‘BOX PLOTS’ contains three graphs.

Other actions include:
- Click and drag thumbnails into closed groups.
- Click and drag the group object (open or closed).
- Click and drag groups into other groups (nested groups).
Add Multiple at Once
Click and drag the horizontal bar to extend the group.
NOTE: The bar can also be used to remove graphs. Click and drag the bar to the left to remove graphs from the group.
Active Graph Indicator
To keep track of the location of the active graph, a blue indicator is shown on the bottom of the group object, when it contains the active graph (outlined in blue).
For example, here the graph ‘Var2’ is the active graph. This graph is in the group called ‘BOX PLOTS’.

When the group is collapsed, the blue indicator continues to identify the group ‘BOX PLOTS’ as containing the active graph.
