DataGraph Reference Manual
-
Getting Started
-
User Interface
-
Input
-
Data Types
-
Data Actions
-
Data Exploration
-
Calculations
-
Graph Settings
-
Common Elements
-
Core Graphing
-
Annotating
-
Data Analysis
-
Functions & Fitting
-
Staying Organized
-
Exporting
-
Scripting
-
Beta
-
Join the Community
Print
Color Ramp Legend
Updated
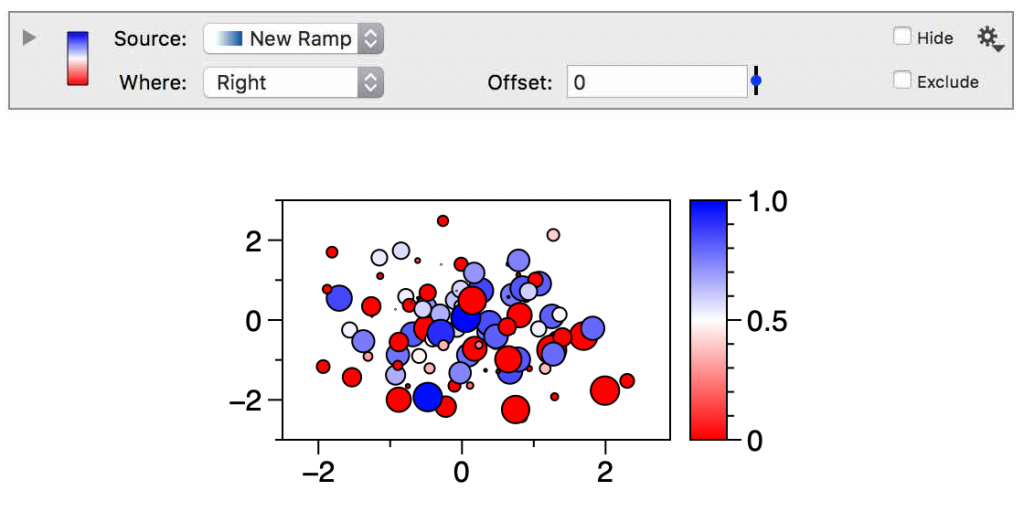
The Color Ramp Legend command allows you to display a color ramp on your figure.

To use the Color Ramp Legend, you need a Color Ramp. Color Ramps allow you to create continuous color schemes, rather than specifying discrete colors for a given value or range of values. Add a Color ramp from the global variables section of the interface.
To display the color ramp on the figure, add a Color Ramp Legend to the list of commands.

Source
Use the menu to select a color ramp to display.

Where
The location of the color ramp relative to the graph.
Offset
The Offset of the location in pixels.
Updated
On This Page