-
Getting Started
-
User Interface
-
Input
-
Data Types
-
Data Actions
-
Data Exploration
-
Calculations
-
Graph Settings
-
Common Elements
-
Core Graphing
-
Annotating
-
Data Analysis
-
Functions & Fitting
-
Staying Organized
-
Exporting
-
Scripting
-
Beta
-
Join the Community
Legend Names
Legends in DataGraph are not displayed by default. To add a legend to your graph, you need to add a Legend command (available from the toolbar or Command menu). The Legend command controls the overall style and formatting of the legend, while the content of each legend entry is determined by the drawing commands in your graph.
Entry box
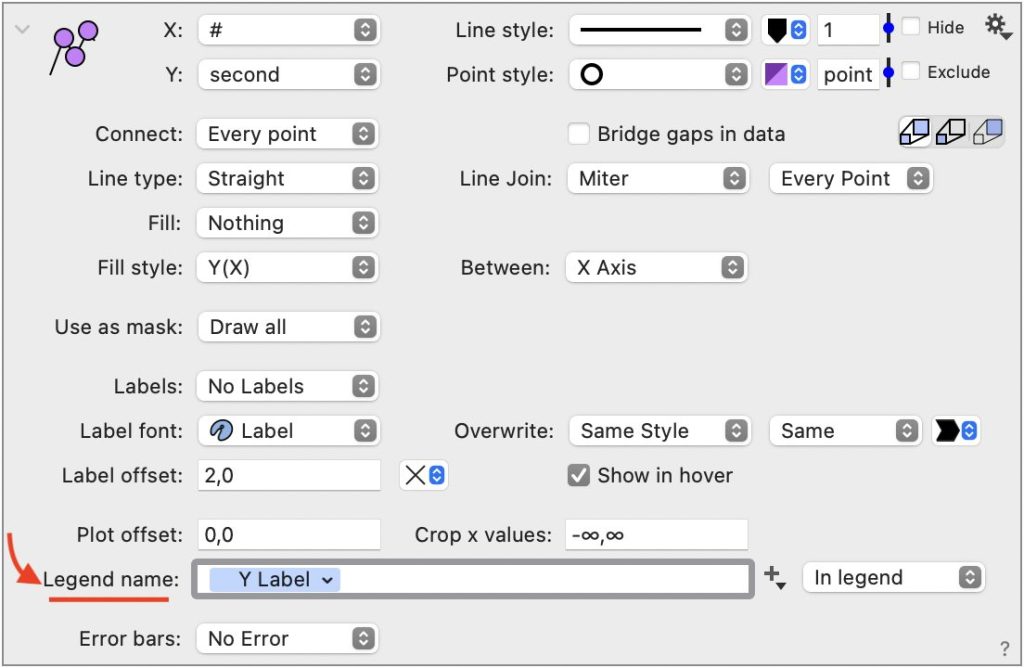
The legend name is specified within each individual drawing command (like Plot, Points, etc.), typically at the bottom of the command settings. By default, the legend name uses a blue token that automatically shows the name of the column being plotted.

Token source
In the Legend name entry box, you will see the blue token that is the legend entry. You can modify the assoicated actual column name in your data table to update the display.

Update text
You can also delete the token entirely and type your own text.
- Within the drawing command settings (near the bottom)
- Directly on the graph by double-clicking the legend entry itself, which opens a popup text box for quick editing

For more complex legend needs, you can use the Custom Legend command instead of the standard Legend command to gain additional control over entries and formatting. This gives you more flexibility when the automatically-created legend doesn’t produce exactly what you want.