Simple Debugging
One of the goals of the external program method is to simplify the creation and development of numerical codes. In particular it is designed around the following programming methodology.
- Set up a sample data set in ImageTank.
- Create an object using an External Program module that takes in the input data and some parameters.
- In Xcode write out a rough idea of what you intend to do and maybe some validation test for your inputs.
- In ImageTank save the input you have for the debugger (explained later).
- Go to Xcode, set a break point and run the program in the debugger, stepping through to verify your code with proper input. The key is that you don’t hard code any test values in the C++ code, they are set in ImageTank and sent over.
- Use this input data to hash out your C++ algorithm.
- Go back in ImageTank, change the input and go back to step 4 above, i.e. you save that new input for the debugger, go to Xcode, test how that works etc.
- Once you have worked that through a few times and you feel that the output should work, look at the output in ImageTank and display it.
- Because ImageTank constantly updates the results you can now vary the the input and see the output change. You might run into issues where things break, in which case you might have to go back to step 4, but otherwise you should start to get a sense of the dynamic properties of your method.
- You can, at any time add, remove or change input and output arguments making iteration easy.
- Once you have created your routine, you can add it to your library of functions. If you use the DTSource arguments for input and outputs you don’t have to make any changes, and it is very easy to reconnect to the function later.
Model problem
This writeup goes through a very simple model to explain these steps. Consider the task of creating a quadratic interpolation going through three points (x0,y0), (x1,y1), (x2,y2) and evaluate that at a set of x values. We will break the problem down as follows
- First specify two points (x0,y0), (x1,y1), and a value x additionally compute a linear interpolation and evaluate it at a single point x.
- Then move to a table of input values x and return a table of values out. This means that the output type will changes
- Change the input into a table with three values. This means change the input argument.
Along the way we will use the following techniques/”tricks”
- Save the input using the debug button
- Change the return type for the computation from a group to a table
- Update the auto generated code as well as the function definition
- Use the pinfo and pall member function to inspect a DTSource object
- Change the input argument list
- Vary the input arguments where we know the exact solution
Basic skeleton
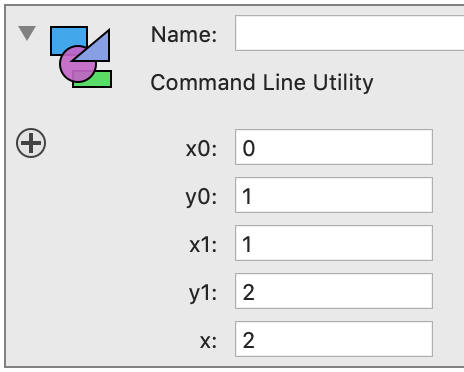
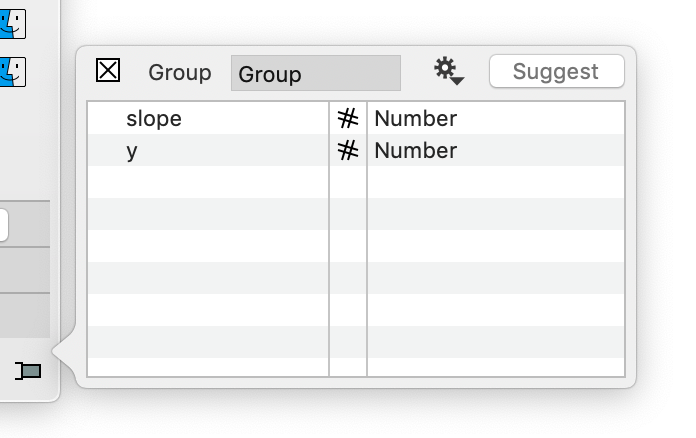
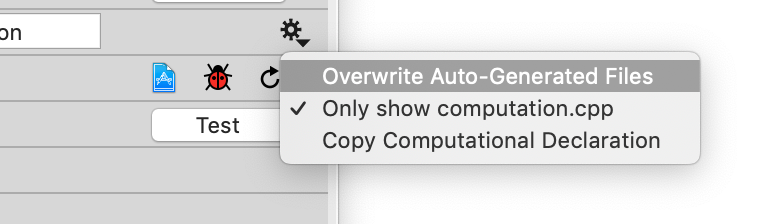
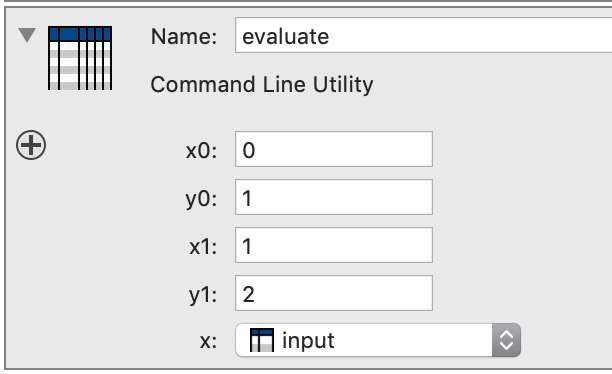
The input consists of five values and even though we only need the y value it is good to return also the slope so that we can double check the result without having to go into the debugger. Note that in the C++ template window only the computation is shown. This is an option you can turn on by using the gear menu. Create the Xcode project at this point.
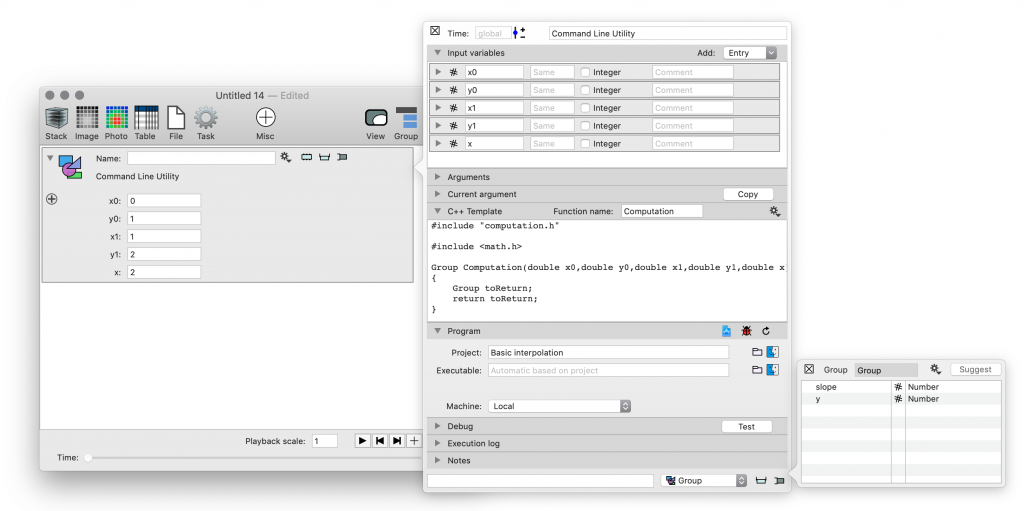
The code is pretty simple
#include "computation.h"

 Group Computation(double x0,double y0,double x1,double y1,double x)
 {
     double slope = (y1-y0)/(x1-x0);

     double y = y0 + slope*(x-x0);

     Group toReturn;
     toReturn.slope = slope;
     toReturn.y = y;
     return toReturn;
 }
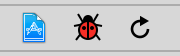
But instead of just trusting this, let’s use the debugger. The first step is to build the executable. Then go into ImageTank and hit the small debug symbol between the Xcode document icon and the reload button.
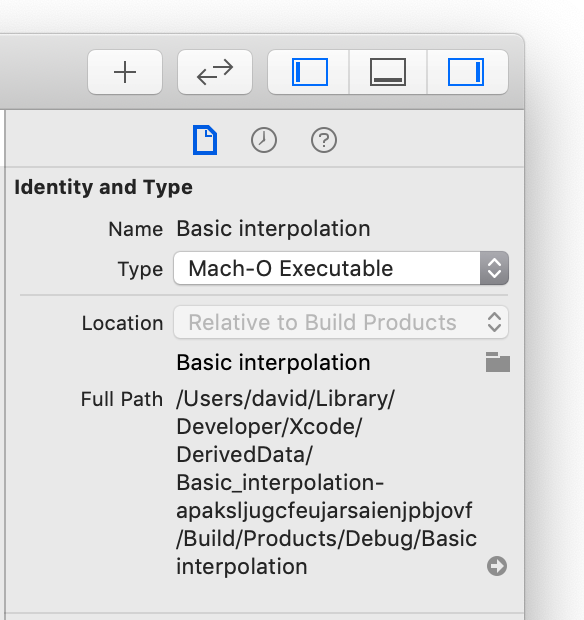
To understand what this does, we need to understand what the compiler creates and what happens when you run the application in the debugger. The compiler creates working directories for saving compiled content and final executable. In the Xcode project you can see the location of the executable. If you select the executable in the file listing and look at the right most column (might need to reveal this through the toolbar) you see the full path of the executable. You can see that there is a Debug folder, and inside that folder is the exectuable.
When you run the program in the debugger, this executable is launched from within this folder (working directory). In the main routine that is created, the input is read from a data file that is referenced using a relative path. This is viewed as relative from the working directory. This is in line 16 in the following image.
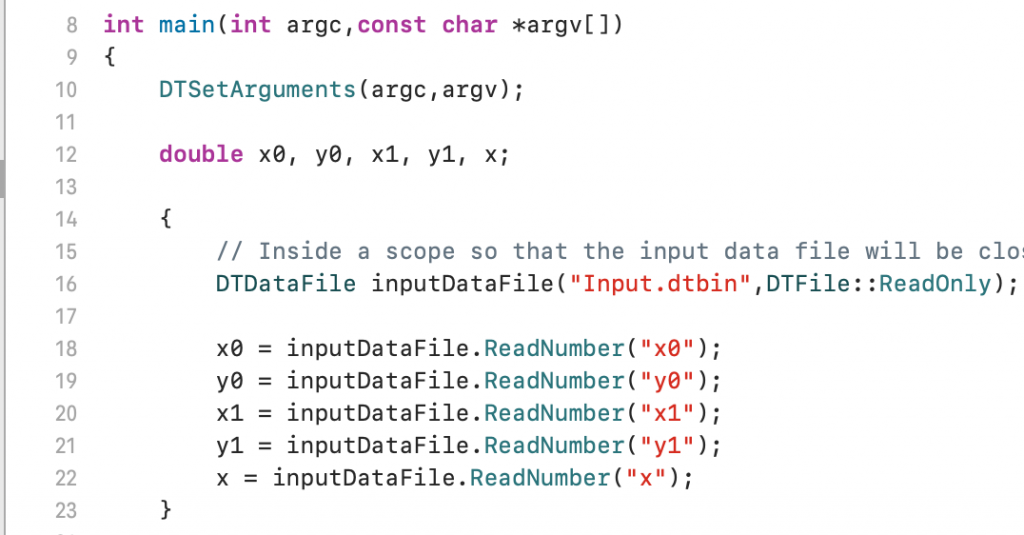
When you press the debug button, ImageTank will create the file Input.dtbin inside this folder and save the current parameters into that file. When ImageTank runs the program, it will create a temporary folder and run the program inside that folder, and not the Debug folder, so that file is not visible, and only exists while the program is running.
Now go into Xcode by clicking on the Xcode file icon. That will open the Xcode project, which will bring it to the front even if it is already open.
Set a breakpoint in the computation.cpp file. Do that by clicking on or to the left of the line number. Then hit the “Play” button in the toolbar to run the program in the debugger. This will automatically compile the program. The first time around the compile will take a little bit of time because there are a lot of source files included, but subsequent builds will be incremental and therefore faster.
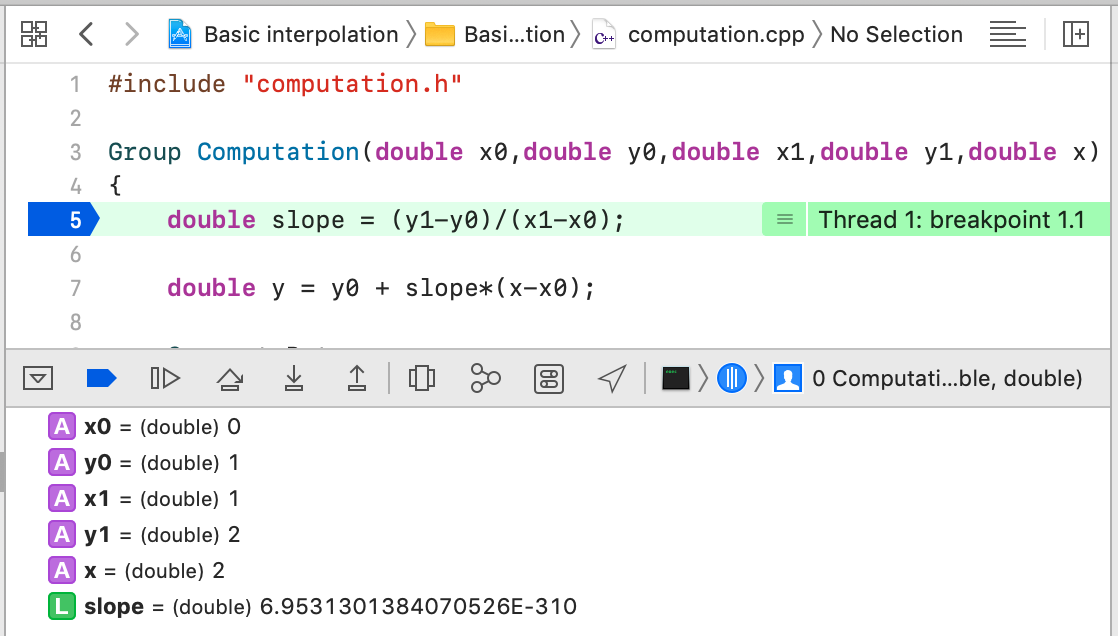
The main routine read in the input from the data file and called the computational routine with the inputs. This matches the inputs that were entered in ImageTank.
One important observation. In the debugger window the slope value shows up but is 6.9… with an exponent of -310. This is because C++, just like C does not initialize values automatically. The content is basically whatever happened to be in that part of memory (the calling stack) and when interpreted as a double precision number it looks random. You can now step through the code and see how the values are updated.
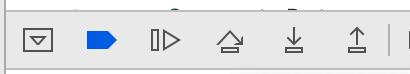
The blue button turns breakpoints on and off, the next is to continue to the next breakpoint, then go to the next line in the current source. The down array means the next operation, and that could mean going into a function that is called. The up arrow means wrap up the current function and go to the calling routine. If you clicked on that here you would go back up to the main routine that called this function.
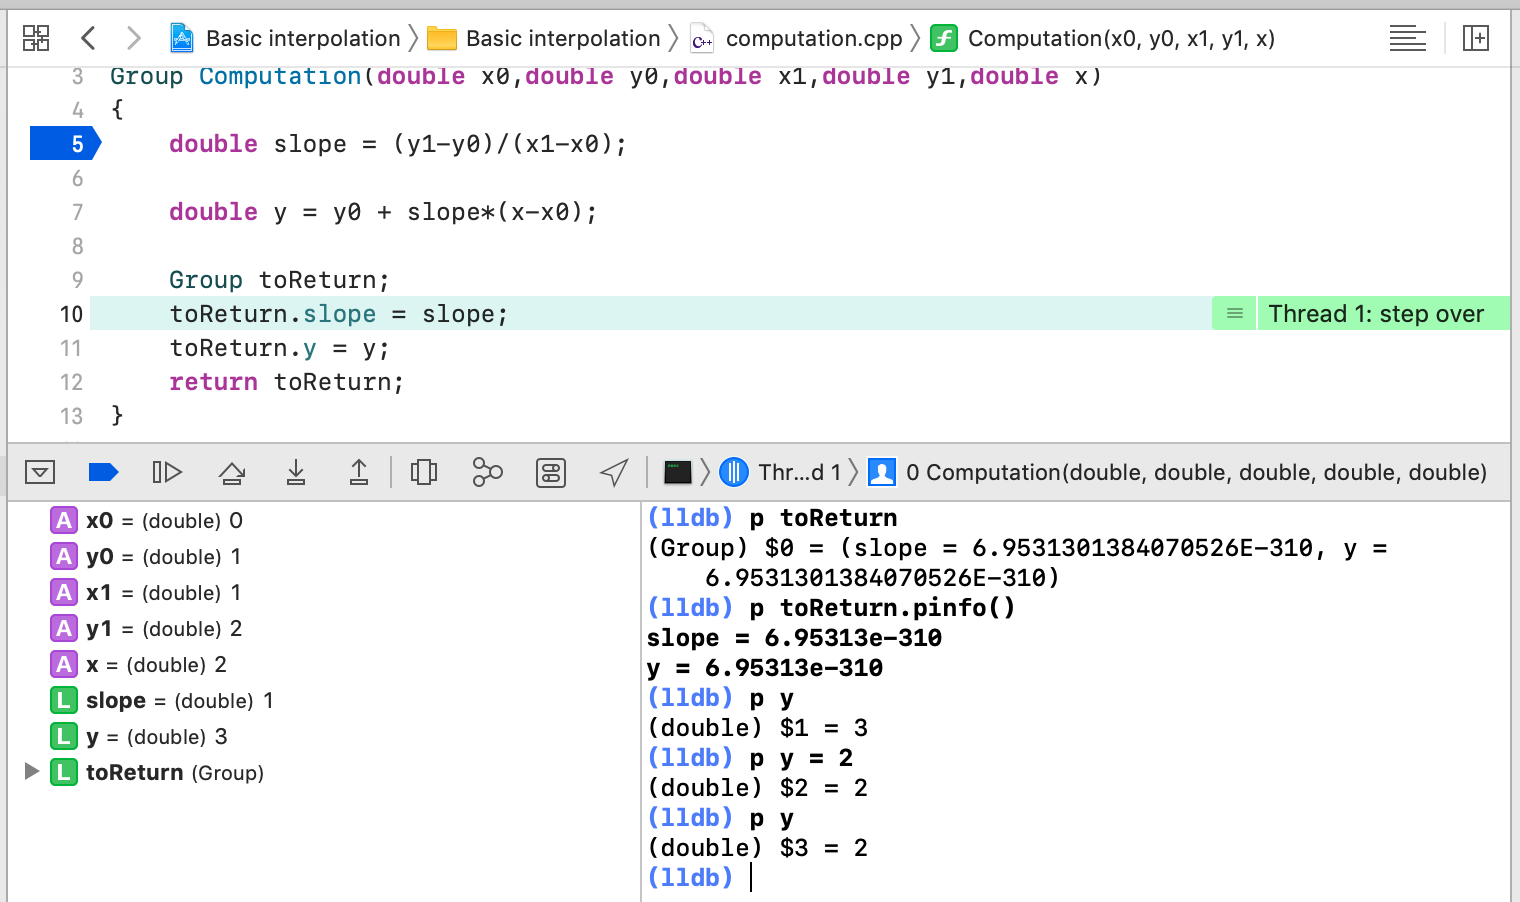
You can change values in the debugger and print them. Consider the steps called in the following screen shot
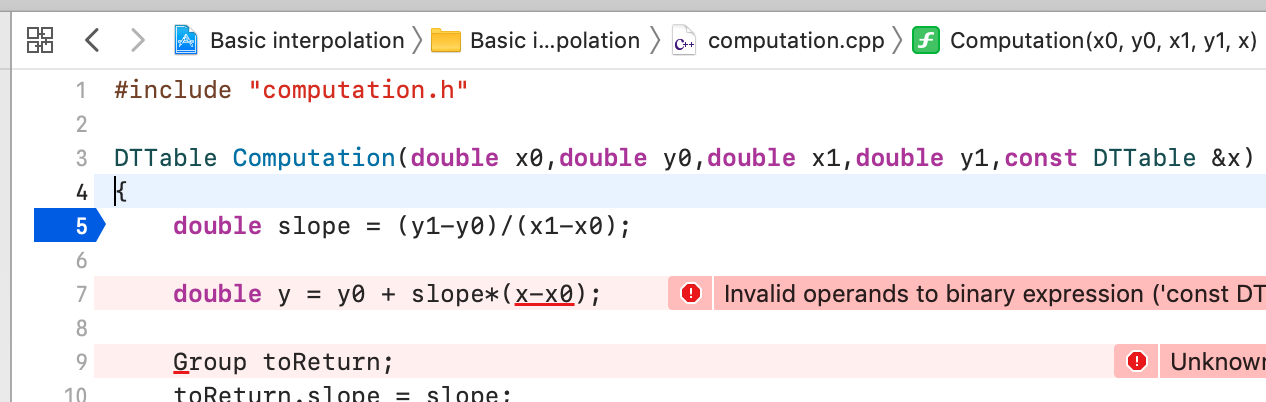
If line 10 and 11 complain that there is no slope and y variables in the group, it is because you forgot to specify them when you defined the output group.
Go back and add your entries, and then select the overwrite action from the code tab.
Back to debugging. The program is currently about to execute line 10. But in the debug console (each line starts with (lldb) ) we typed in a few commands manually.
p toReturn
prints the toReturn structure. This uses the print method that the debugger uses for any structure. The values are comma separated and not initialized.
p toReturn.pinfo()
This calls a member function for the Group structure. This prints out the content, but this is formatted better. This is a function that was automatially generated by ImageTank.
The statement
p y = 2
needs a little bit of an explanation. What that will do is to execute the command y = 2 and then print the result. This is a way to change the value of y. You can also do “e y = 2” which is short for “expression y = 2” just like “p y = 2” is short for “print y = 2” Leaving out the command p/e etc will not work. In that way this is not like a scripting language. You can’t create new variables either, just print and overwrite values that exist.
If you make changes, just re-run it using the Play button in the toolbar. It will use the input file that was saved earlier. If you want to test a different initial condition, you could change them in the debugger, but it is typically easier to go back into ImageTank, change the values and then click the Debug button again to re-save the input file.
Once it looks like the program runs properly, go back into ImageTank and try it with other values. Use the variable monitor to see the output. The output is updated as soon as you either go to the next field or click on the return/enter key to close the field you are editing.
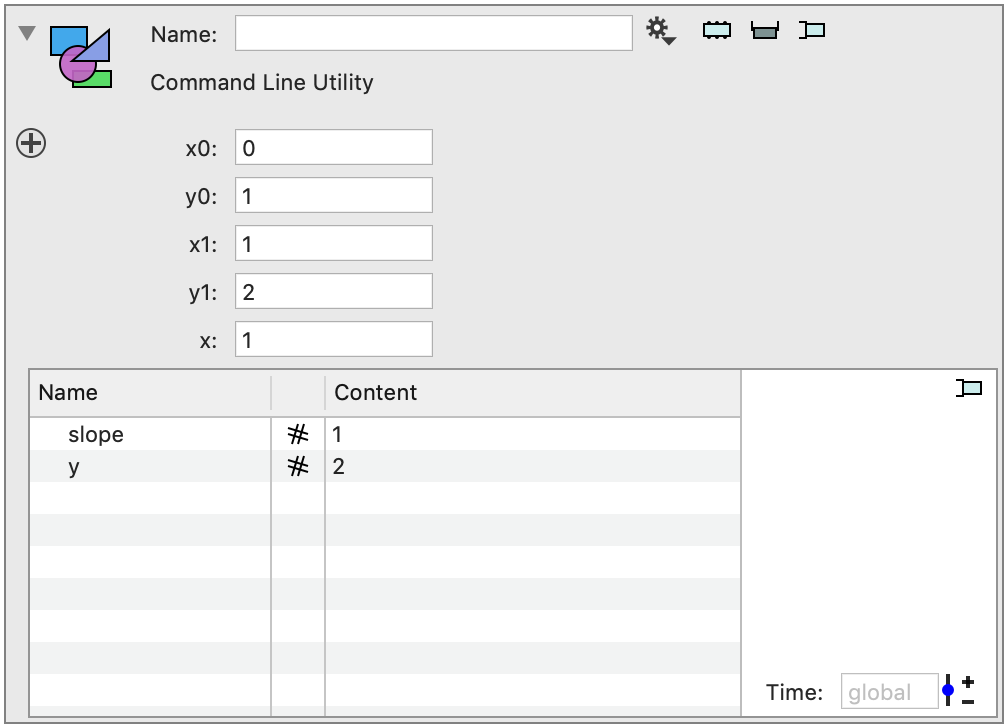
In particular, try x = 0 and x=1 since you should get the y values back. If you made changes in Xcode, you might have to click on the Reload button the side panel. But if you change the input, the program needs to be re-run anyway and that will run the latest version of the program.
Changing the output type
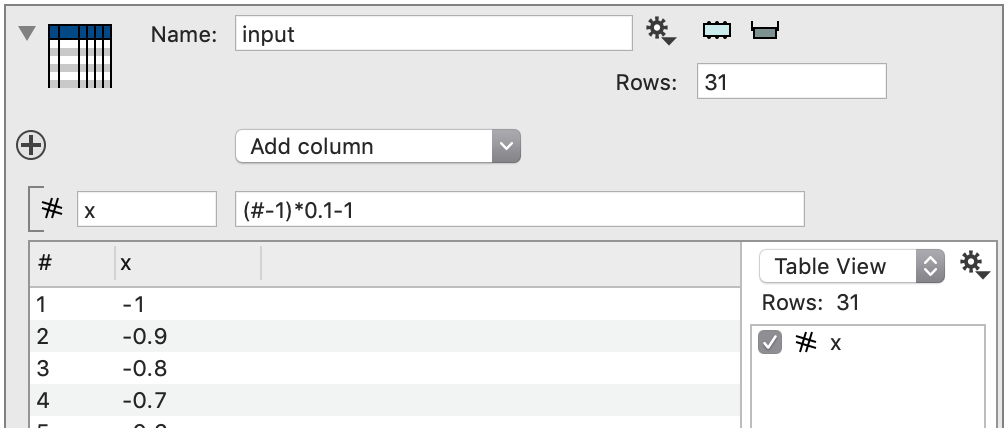
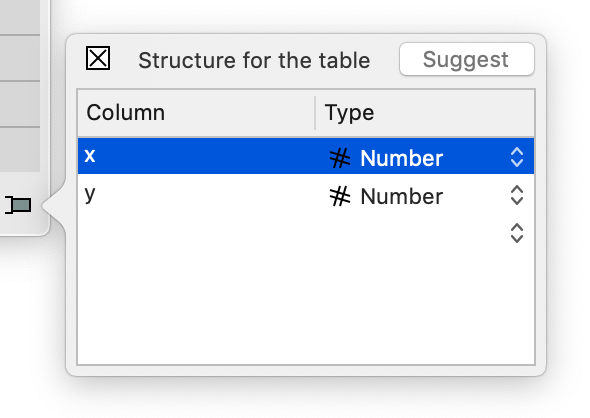
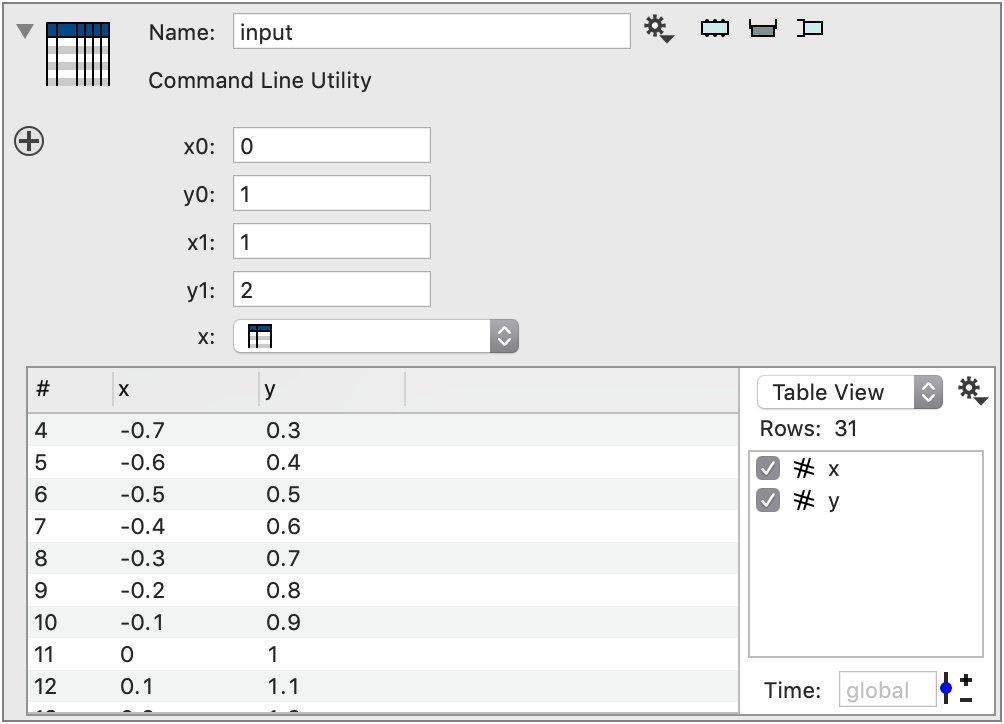
The next step is to change the input and output to tables. We will still send the x0, y0, x1, x2, and x as individual numbers. To create the input table, use the expression method
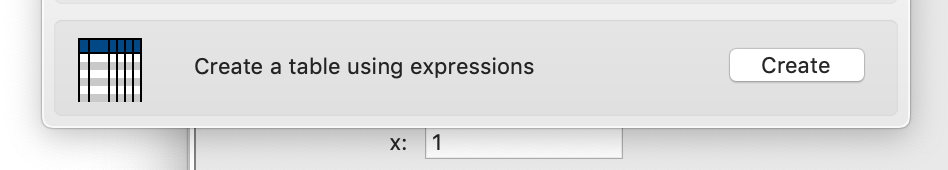
Create a collection of x values using an expression in #, the row number.
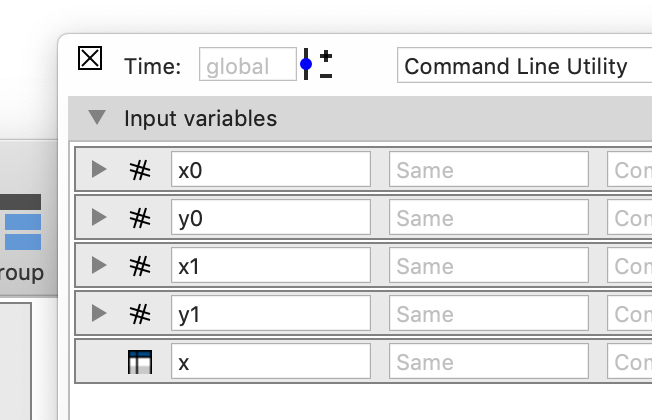
Now drag this table into the Input variables list. This will also select this table as the input, but that you can change later if you want to use a different table variable for the x values. Delete the old x value by just clicking on the icon and hit delete.
It is instructive to see what happens if you hit the Debug button again and run the program in Xcode. You get the following error message in the debugging window
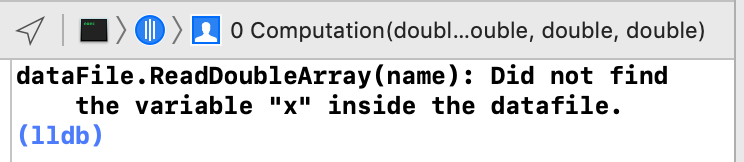
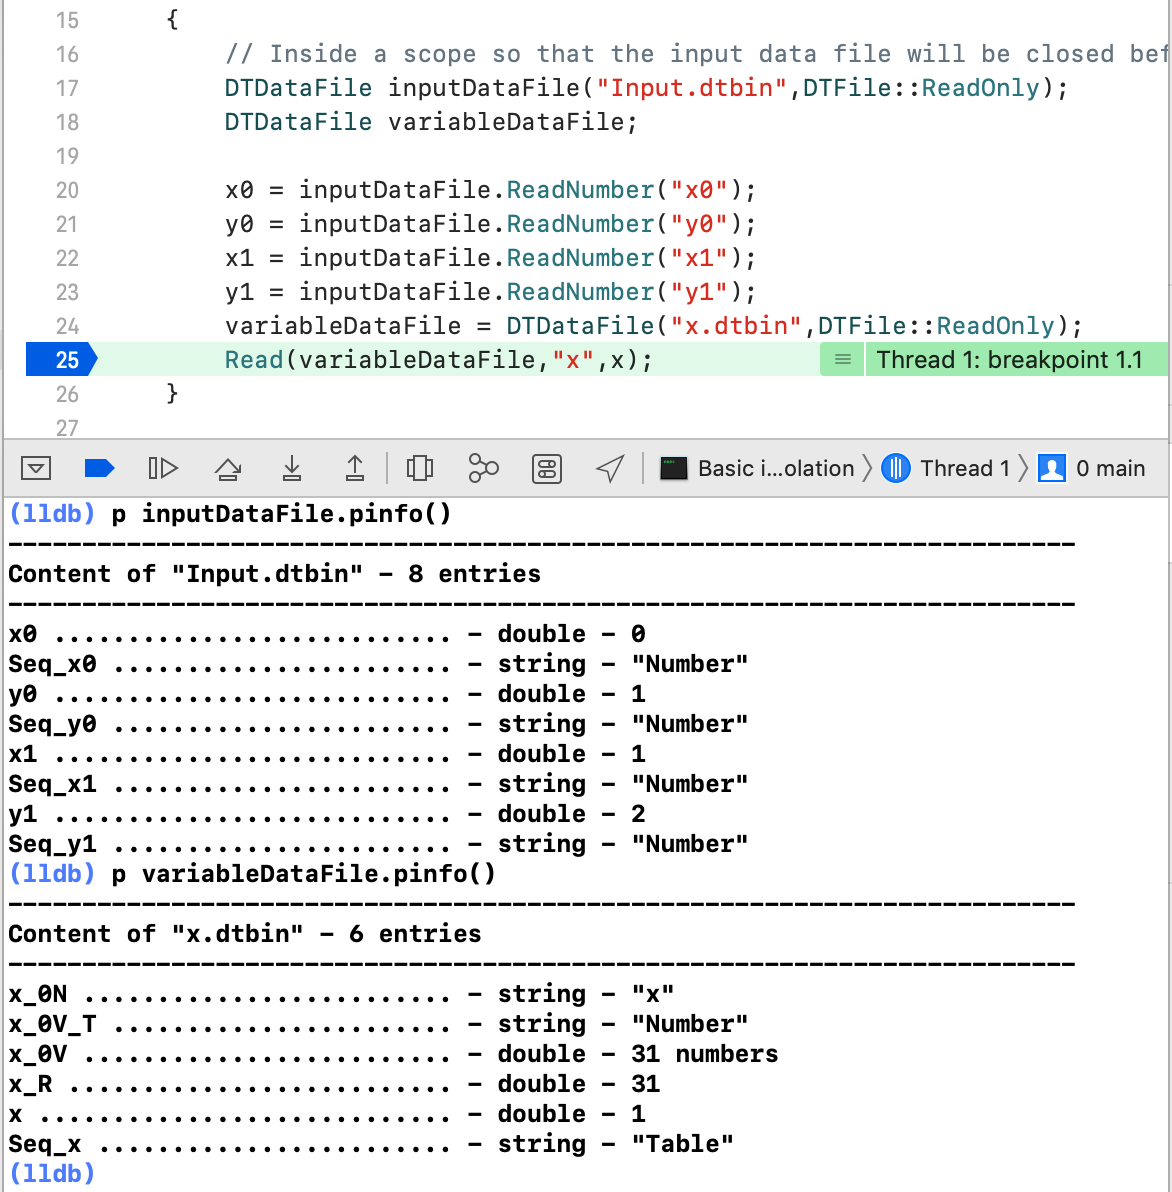
Let’s dig into the reason for this a little bit. To do that, go into the main.cpp file and set a break point where the variables are read from the input file.
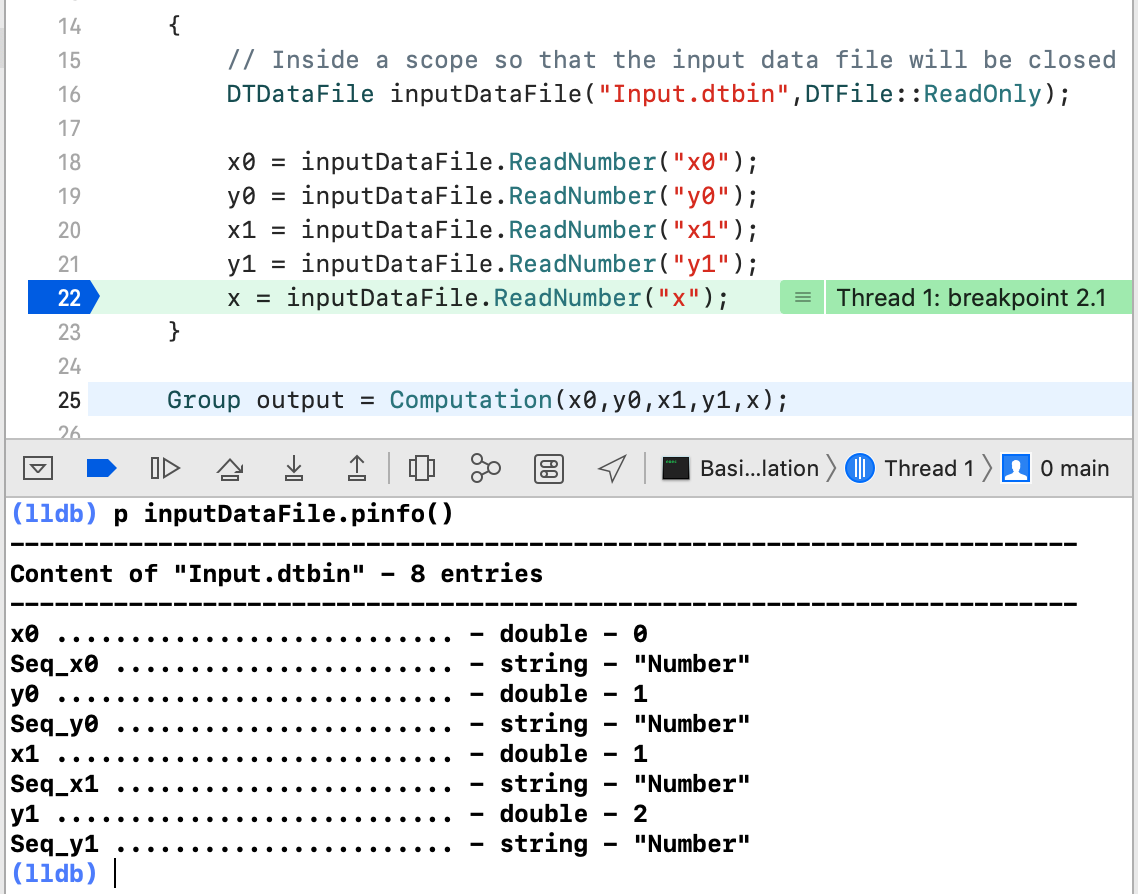
I’ve called inputDataFile.pinfo() to print information about the input file. This displays the table of contents of this file.
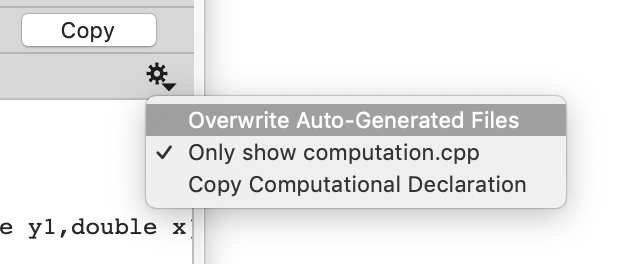
The reason is that even though you changed the input, your C++ code didn’t change. ImageTank changed what it saved, and the x variable was not saved into the “Input.dtbin” file like before. It also has a different type. Clearly we need to read a DTTable rather then a double number. Instead of trying to guess how main.cpp needs to change, we go back into ImageTank and use the gear menu in the C++ template tab.
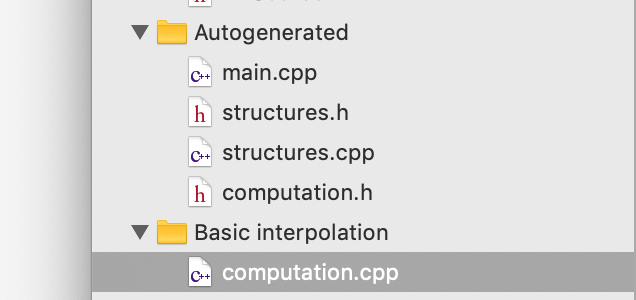
This overwites the files that are in the Autogenerated folder, including main.cpp to handle the new input and output. This does not touch the computation.cpp file, so the old function definition is used.
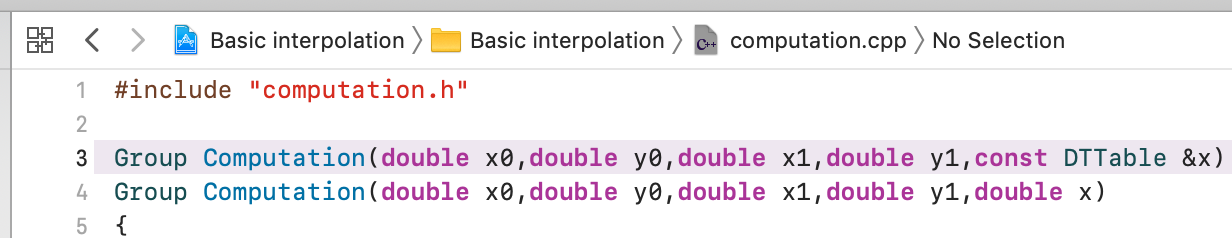
However, the gear menu does copy into the clipboard the new function name (same as the last entry in the context menu). In the following screenshot it is shown right above the old one. Paste this over the old definition
This however is not enough since we also want to return a table, not a group. This is done in the side bar.
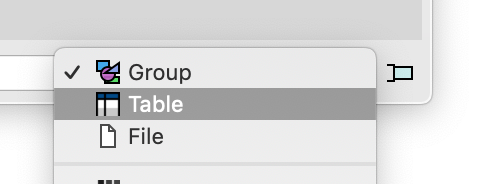
When you do that you see that the icon for the variable changes.
Normally, at this time you would also set the return structure, but that is not necessary as will be shown later.
Use the gear menu again to overwrite the auto-generated files and paste the new function definition into the computation.cpp file. At this point, there are a lot of compile errors. In practice you would change input and output and just overwrite the autogenerated content and function call in computation.cpp once.
We need to update the code to get the input values from a table and return a table.
DTTable Computation(double x0,double y0,double x1,double y1,
                    const DTTable &x)
 {
     double slope = (y1-y0)/(x1-x0);

     ssize_t N = x.NumberOfRows();
     DTMutableDoubleArray yOut(N);

     DTTableColumnNumber xIn = x("x");
     DTDoubleArray xValues = xIn.DoubleVersion();

     for (int i=0;i<N;i++) {
         yOut(i) = y0 + slope*(xValues(i)-x0);
     }

     DTMutableList<DTTableColumn> columnsOut(2);
     columnsOut(0) = x("x");
     columnsOut(1) = CreateTableColumn("y",yOut);

     return DTTable(columnsOut);
 }
If we look at the auto-generated main.cpp file in the debugger we can see what has changed in how ImageTank saves the input. It is currently using two files, Input.dtbin and x.dtbin. The Input.dtbin file contains the small variables, which might change frequently. The file x.dtbin only contains the table. This is done because in many cases this table can be pretty large and ImageTank might not need to re-save the table every time the program is called. Also, you can ask ImageTank to run this program on a different machine and that way the table does not have to be uploaded repeatedly.
In ImageTank you can now see the entire list
The next step is to change the input argument to get the (x0,y0) and (x1,y1) from a table rather than individual values. The output changes to a lot of NaN values. This is because the program definitely does not expect the table without modification. Let’s use this as an opportunity to show a couple of methods to help debug.
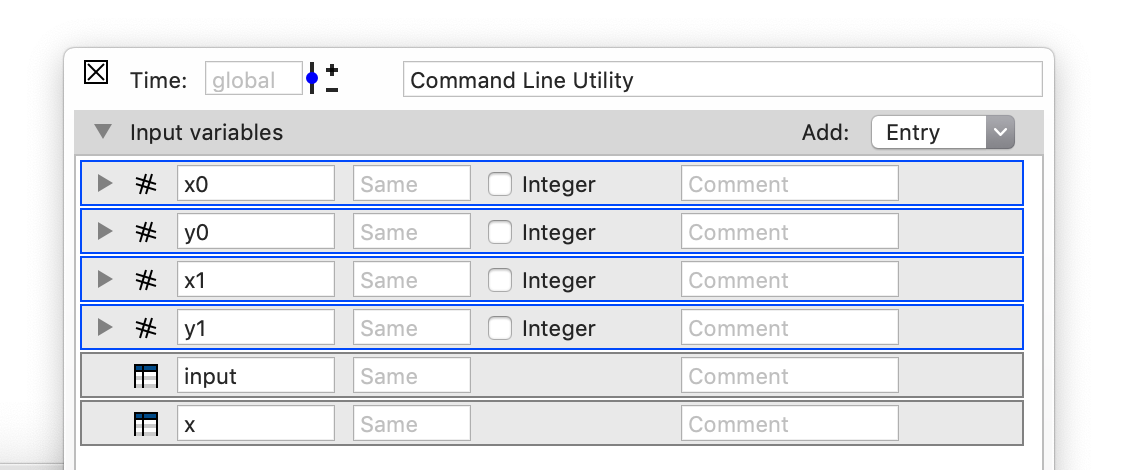
Add in a table – input, select the x0,y0,x1,y1 and delete them.
First is the Debug tab. When you click on the Test button, ImageTank will run the program in a temporary location (not the Xcode Debug folder), and show the standard output from the program. Clearly it is trying to read in the input variables from the input file and not finding anything.
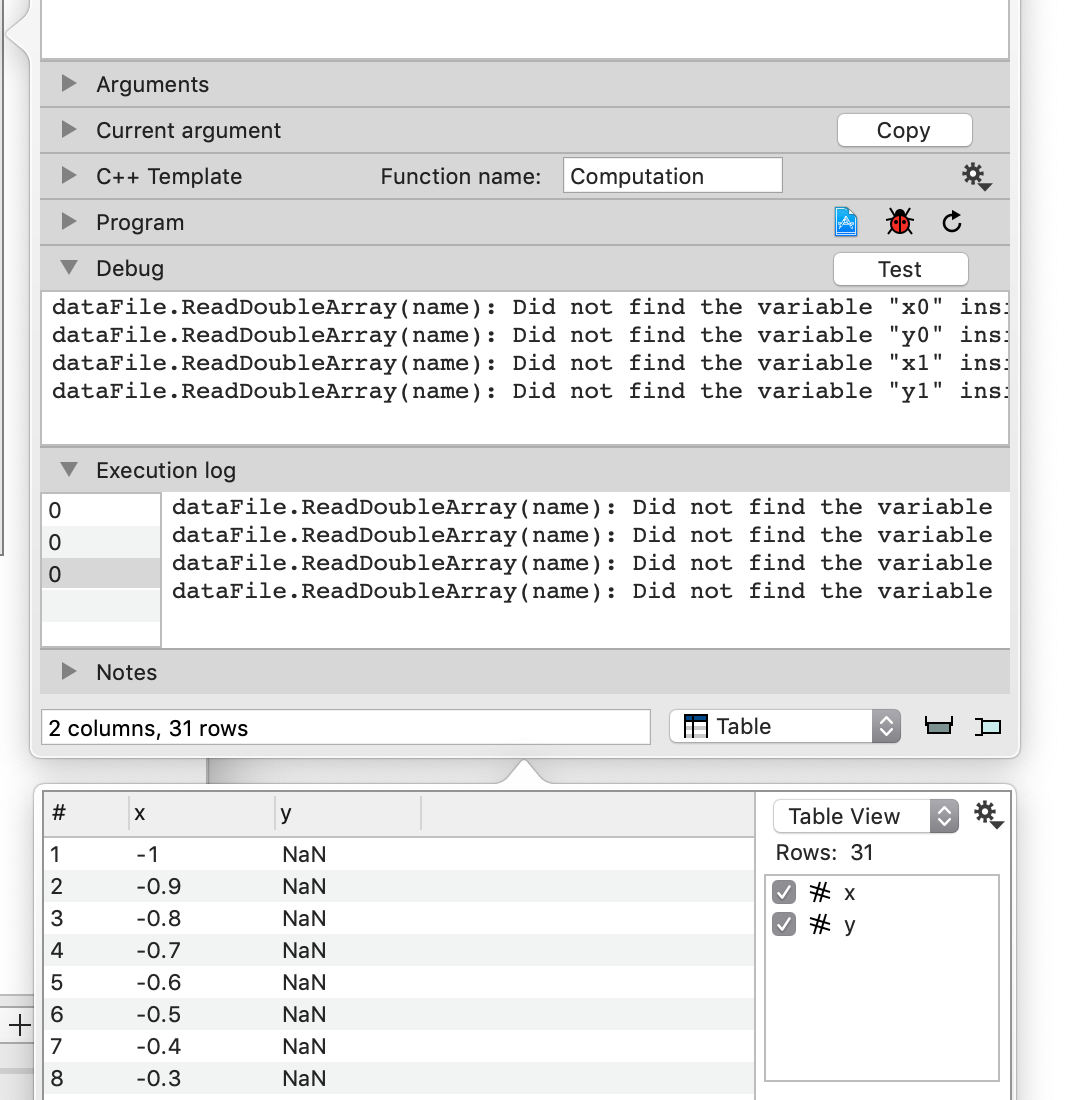
The other is the Execution log. ImageTank runs the program when it needs the result. Once it has the result, it will keep the data until you change the input, reload the program, or there isn’t enough cache available to store it.
ImageTank will keep track of all of the standard output that was generated, and you can go browse through the outputs. The 0 value indicates that it is for time value 0. This is related to caching and collections and we will not describe that here in more detail.
You need to update the argument list once again, which again starts by overwriting the auto-generated files and then extracting the x0,y0,x1,y1 values from the table.
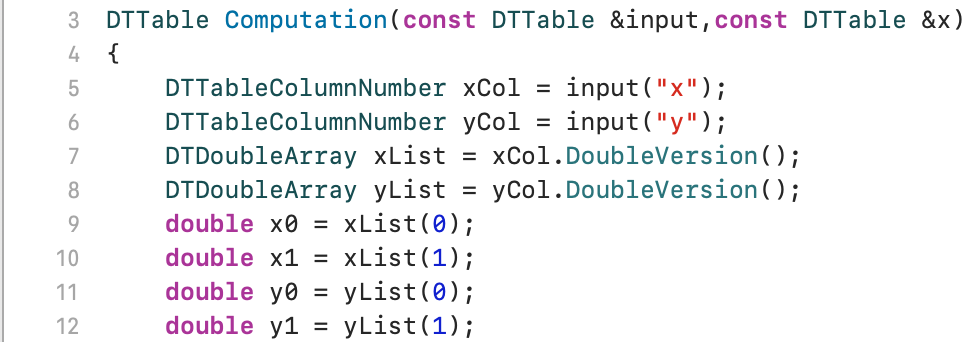
The next step is to use an interpolation method based on the number of rows in the table, i.e. the length of the xList.