ImageTank Reference Manual
-
Getting Started
-
Examples
-
Input
-
Bitmaps
-
Images
-
Image Stack
-
Tables
-
2D Path
-
2D Region
-
3D Surface
-
Slicers
-
Transformations
-
Time series
-
DTSource
-
External Programs
-
FAQs
-
Group
-
2D Mask
-
Sets
-
Snapshots
Print
Q-Q plot
Updated
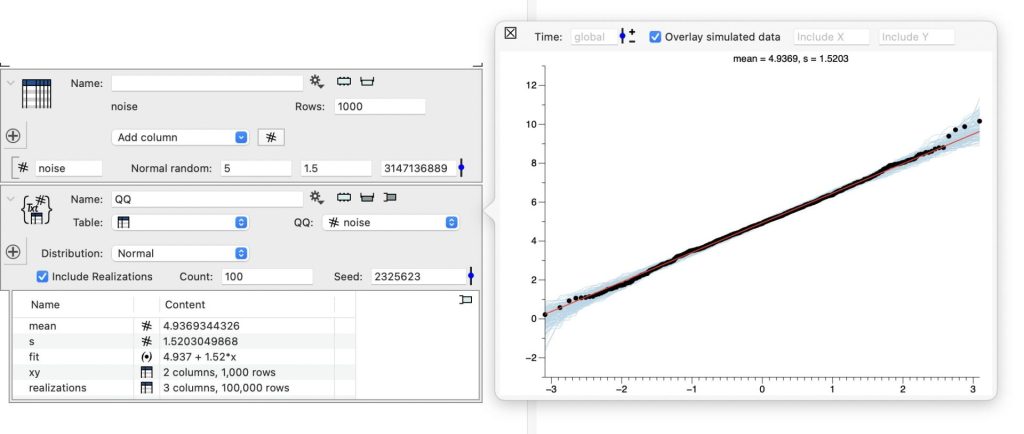
This is an implementation of a QQ plot to compare a propability distribution to a standard form. Two distributions are implemented normal and exponential.

On This Page