Pick Points Manually
In a perfect world you would set up a numerical pipeline to find points of interest automatically. But sometimes that is not practical, and you want a way to just click on the point and mark it.
The fundamental problem with that typically that is something that is done with a mouse, the points is copied into a spreadsheet and you go to the next point. This makes verifying your work, or someone elses work a lot harder. When an outlier shows up, you aren’t quite sure where that happened and repeating the entire process is just as likely to give you errors elsewhere.
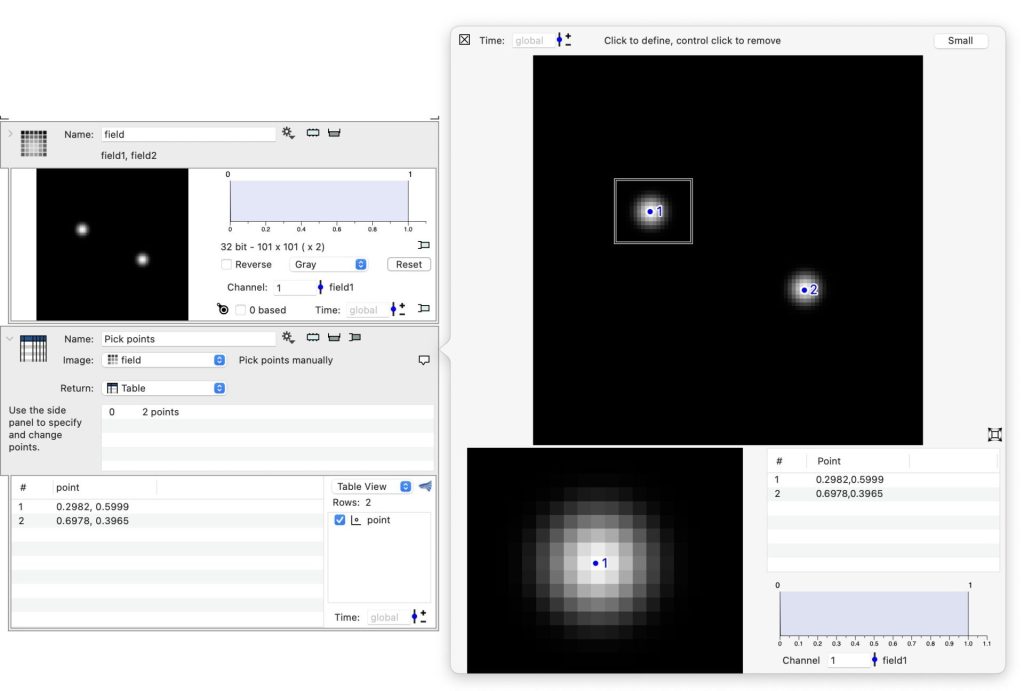
The goal of this object is to not only give you a way to click on a point and see the coordinate, the coordinate is saved into a table and saved as part of the file. You can then use that table for further analysis in ImageTank, or copy it from the variable monitor and paste into DataGraph.
To do this, just click on the side panel. In that side panel you can adjust the coloring and the channel you want to use for visual guidance.

You can drag existing points around, either in the full view or the magnified view for exact placement. If you click away from a point you add a point. If you hold down the control key and click on a point it removes the point.
Time series
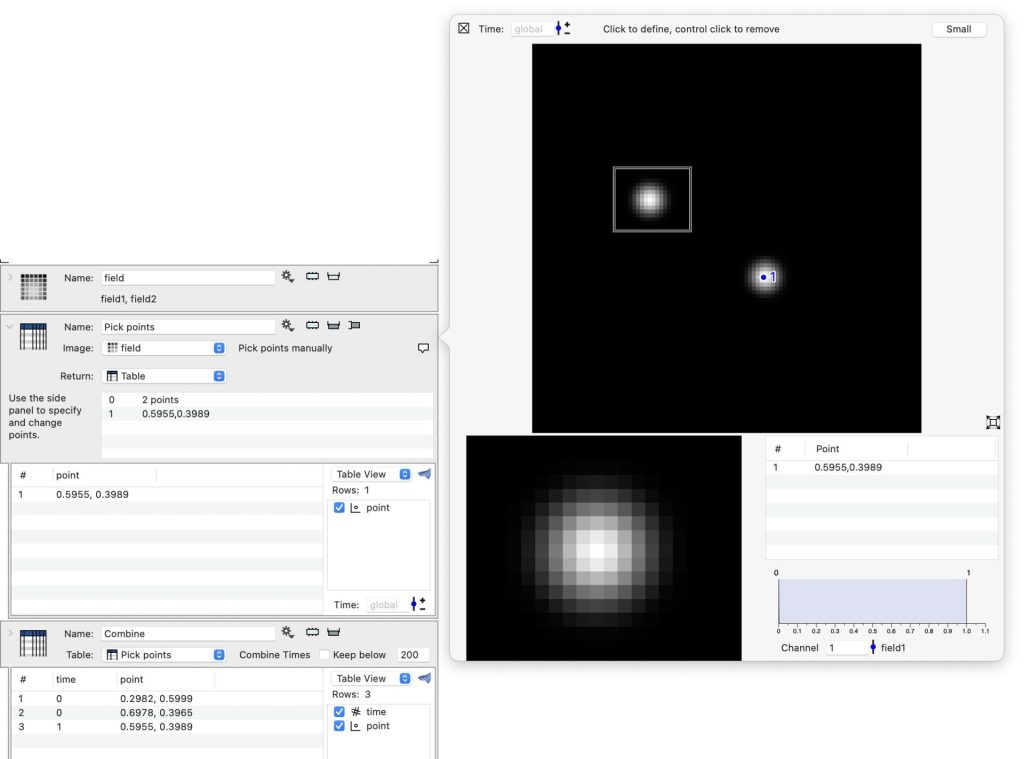
If the image has a time series, the points are associate with the time value. That means that the output table becomes a time series. You can then combine all of the time values to get the points for all of the time values.
