The biggest thing in DataGraph 5.2 is the new single file format option. This new format makes it easier to share files and works better with cloud syncing services. DataGraph 5.2 also introduces a new capability for the Region command, which can interactively select and highlight a group of points from a graph. Check out the full list of improvements below.
New Single File Format
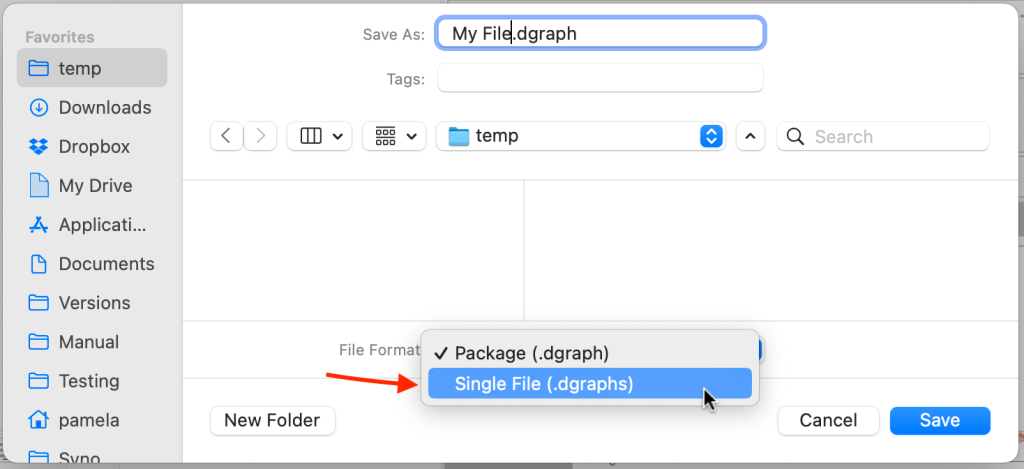
Now you have two options for saving files: the traditional Package file format and the new Single file format. For new files, select the format in the Save dialog.
The Package format remains the default, but you can change the default file format in the Settings. The single file format is recommended when syncing with cloud applications (e.g., Google Drive, One Drive, etc.).
Are there any downsides to the single file format? If you are working with very large sets of data (>10GB), the *.dgraphs format may be slower at saving than the *.dgraph package file format. So keep that in mind as you consider what format to use. If you want to use a single file format with a large data set, you may want to link to your data instead of importing it into DataGraph. If you’re unsure what to do, please contact us for advice on your application.
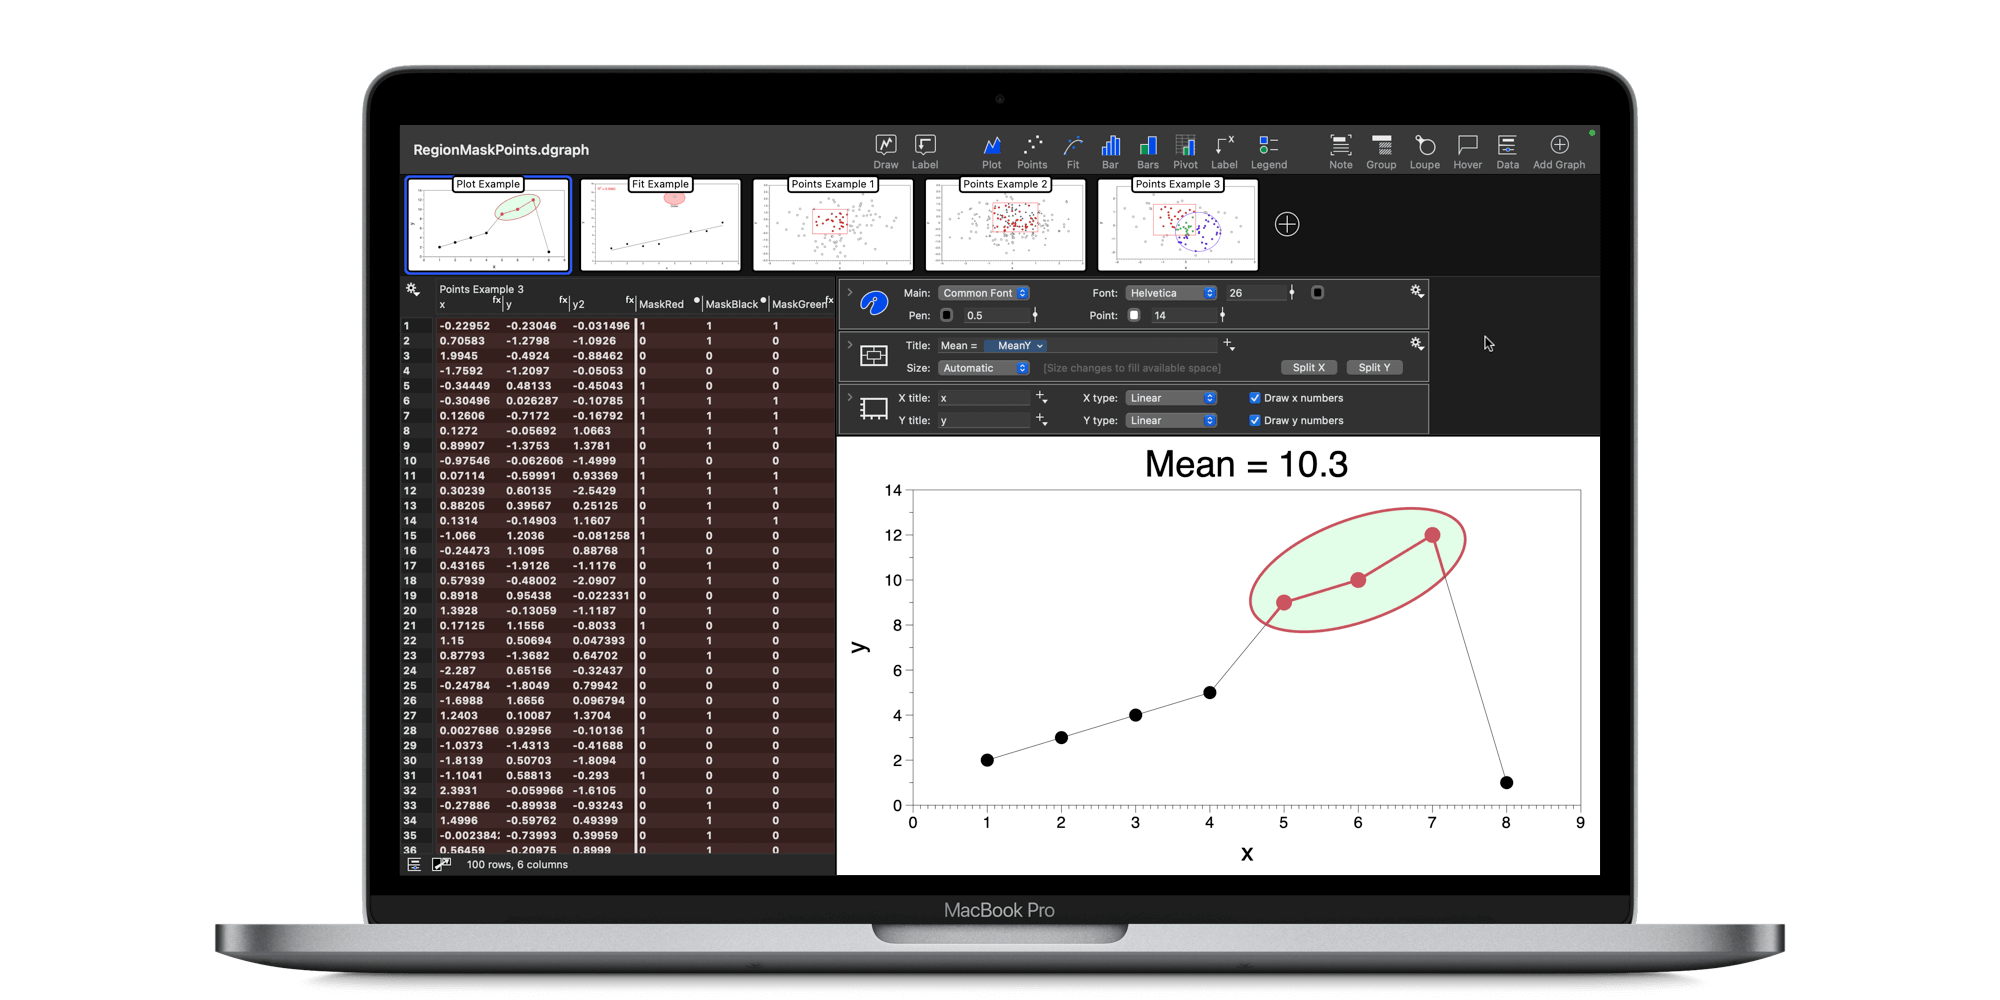
Updated Region Command
The Region command now lets you select points inside a shape you are drawing (e.g., ovals, rectangles, ellipses). Use this command to select x-y locations from Point and Plot commands interactively. Use this functionality to select points for other commands, analyze clusters, or perform calculations on a subset of values.

Other Improvements
- Use relative path names for File Links. DataGraph 5.1 added file links. In DataGraph 5.2, this functionality has been improved and now allows you to use relative path names, making it easer to share files across computers.
- More options in the Custom Legend command. The Custom Legend command has been improved with a new look and more formatting options.
- Output a list of outliers from the Box Command. Now you extract a column to find outliers in your data. Use to count the number of outliers or omit them from further analysis.
- The Hover box now works for the Plots command.
- Add Text command labels at specific (x,y) coordinate locations.
Fixed
- Fixed a resolution issue on Sonoma.
- Fixed an issue with File Links.
- Other minor improvements and fixes.
Leave a Reply
You must be logged in to post a comment.